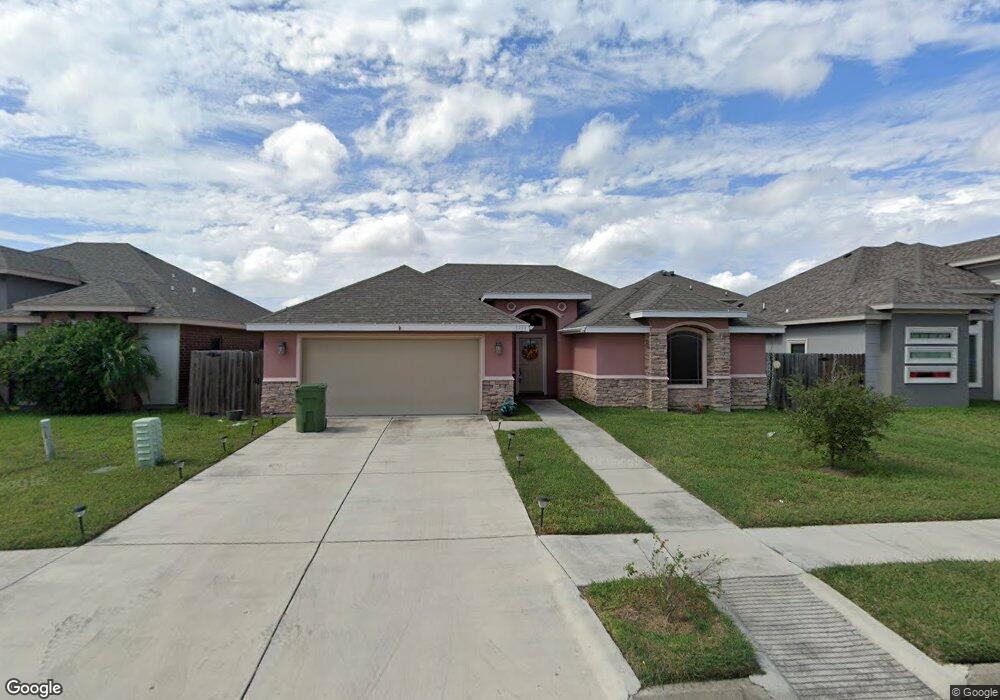
3733 Altamira St Unit LOT 29 BLK 6 Brownsville, TX 78520
Northwest Brownsville NeighborhoodEstimated Value: $153,000 - $268,000
--
Bed
--
Bath
1,415
Sq Ft
$156/Sq Ft
Est. Value
About This Home
This home is located at 3733 Altamira St Unit LOT 29 BLK 6, Brownsville, TX 78520 and is currently estimated at $220,206, approximately $155 per square foot. 3733 Altamira St Unit LOT 29 BLK 6 is a home located in Cameron County with nearby schools including Ortiz Elementary School, Edward Manzano Jr. Middle School, and Pace Early College High School.
Ownership History
Date
Name
Owned For
Owner Type
Purchase Details
Closed on
Dec 22, 2015
Sold by
Perez Jose and J Perez Consulting Services
Bought by
Powers Brittany
Current Estimated Value
Home Financials for this Owner
Home Financials are based on the most recent Mortgage that was taken out on this home.
Original Mortgage
$135,990
Outstanding Balance
$107,112
Interest Rate
3.75%
Mortgage Type
FHA
Estimated Equity
$113,094
Purchase Details
Closed on
Aug 20, 2015
Sold by
Santander Properties Ltd
Bought by
Perez Jose and Perez Consulting Services
Home Financials for this Owner
Home Financials are based on the most recent Mortgage that was taken out on this home.
Original Mortgage
$90,000
Interest Rate
4.08%
Mortgage Type
Purchase Money Mortgage
Create a Home Valuation Report for This Property
The Home Valuation Report is an in-depth analysis detailing your home's value as well as a comparison with similar homes in the area
Home Values in the Area
Average Home Value in this Area
Purchase History
| Date | Buyer | Sale Price | Title Company |
|---|---|---|---|
| Powers Brittany | -- | None Available | |
| Perez Jose | -- | Stewart Title Co |
Source: Public Records
Mortgage History
| Date | Status | Borrower | Loan Amount |
|---|---|---|---|
| Open | Powers Brittany | $135,990 | |
| Previous Owner | Perez Jose | $90,000 |
Source: Public Records
Tax History Compared to Growth
Tax History
| Year | Tax Paid | Tax Assessment Tax Assessment Total Assessment is a certain percentage of the fair market value that is determined by local assessors to be the total taxable value of land and additions on the property. | Land | Improvement |
|---|---|---|---|---|
| 2025 | $4,538 | $197,884 | $58,500 | $139,384 |
| 2024 | $4,538 | $199,372 | $58,500 | $140,872 |
| 2023 | $4,436 | $193,363 | $51,000 | $142,363 |
| 2022 | $3,724 | $143,588 | $37,500 | $106,088 |
| 2021 | $3,712 | $143,588 | $37,500 | $106,088 |
| 2020 | $3,768 | $144,677 | $37,500 | $107,177 |
| 2019 | $3,575 | $134,263 | $26,000 | $108,263 |
| 2018 | $3,602 | $135,625 | $26,000 | $109,625 |
| 2017 | $3,182 | $125,531 | $25,000 | $100,531 |
| 2016 | $3,428 | $135,258 | $25,000 | $110,258 |
| 2015 | $633 | $25,000 | $25,000 | $0 |
Source: Public Records
Map
Nearby Homes
- 3564 Oviedo Dr
- 3770 Altamira
- 4025 Sevilla St
- 3949 Galicia Ct Unit 17
- 4071 Orense Dr
- 3837 Ridge Trail
- 3915 Ridge Trail
- 4170 Oak Hurst Dr
- 2655 Laredo Rd
- 2782 Normandy St
- 2451 Quail Trail
- 1208 Costa Del Sol
- 2480 Quail Trail
- 2848 Riviera St
- 1272 Costa Del Sol
- 1332 Costa Del Sol
- 3516 Hidalgo Cir Unit LOT 1 BLK 4
- 3604 Hidalgo Cir Unit LOT 1 BLK 6
- 109 Dix Dr
- 137 Ruben M Torres Blvd
- 3717 Altamira St Unit LOT 25 BLK 6
- 3729 Altamira St Unit LOT 28 BLK 6
- 3725 Altamira St Unit LOT 27 BLK 6
- 3730 Altamira St Unit LOT 11 BLK 7
- 3721 Altamira St
- 3718 Altamira
- 3734 Altamira
- 3885 Astorga Ln
- 3632 Oviedo
- 3640 Oviedo
- 3713 Altamira
- 3628 Oviedo
- 3636 Oviedo
- 3879 Astorga Ln Unit lot 14 blk 3
- 3644 Oviedo
- 3738 Altamira
- 3737 Altamira St Unit LOT 30 BLK 6
- 3737 Altamira St
- 3710 Altamira
- 3710 Altamira Unit LOT 3 BLK 8