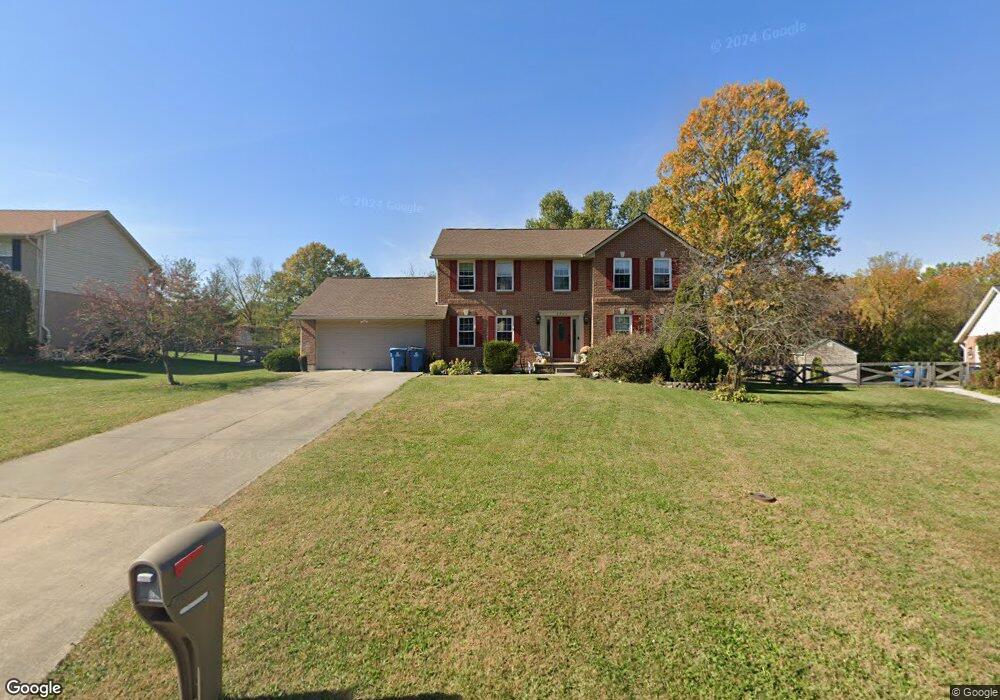
3733 Maplebrooke Ln Unit Lt 6 Amelia, OH 45102
Estimated Value: $369,050 - $397,000
4
Beds
3
Baths
2,144
Sq Ft
$179/Sq Ft
Est. Value
About This Home
This home is located at 3733 Maplebrooke Ln Unit Lt 6, Amelia, OH 45102 and is currently estimated at $384,013, approximately $179 per square foot. 3733 Maplebrooke Ln Unit Lt 6 is a home located in Clermont County with nearby schools including Merwin Elementary School, West Clermont Middle School, and West Clermont High School.
Ownership History
Date
Name
Owned For
Owner Type
Purchase Details
Closed on
Feb 22, 2022
Sold by
Rose Robert A and Rose Maria L
Bought by
Finley Reid D
Current Estimated Value
Home Financials for this Owner
Home Financials are based on the most recent Mortgage that was taken out on this home.
Original Mortgage
$259,250
Outstanding Balance
$240,733
Interest Rate
3.55%
Mortgage Type
New Conventional
Estimated Equity
$143,280
Purchase Details
Closed on
Sep 27, 2001
Sold by
Schmidt Bldrs Inc
Bought by
Rose Robert A and Rose Maria L
Home Financials for this Owner
Home Financials are based on the most recent Mortgage that was taken out on this home.
Original Mortgage
$155,100
Interest Rate
6.97%
Mortgage Type
New Conventional
Purchase Details
Closed on
Feb 22, 2001
Sold by
Todd Dev Co Inc
Bought by
Schmidt Bldrs Inc
Create a Home Valuation Report for This Property
The Home Valuation Report is an in-depth analysis detailing your home's value as well as a comparison with similar homes in the area
Home Values in the Area
Average Home Value in this Area
Purchase History
| Date | Buyer | Sale Price | Title Company |
|---|---|---|---|
| Finley Reid D | $305,000 | Fletcher Michael C | |
| Rose Robert A | $172,400 | -- | |
| Schmidt Bldrs Inc | $62,000 | -- |
Source: Public Records
Mortgage History
| Date | Status | Borrower | Loan Amount |
|---|---|---|---|
| Open | Finley Reid D | $259,250 | |
| Previous Owner | Rose Robert A | $155,100 |
Source: Public Records
Tax History Compared to Growth
Tax History
| Year | Tax Paid | Tax Assessment Tax Assessment Total Assessment is a certain percentage of the fair market value that is determined by local assessors to be the total taxable value of land and additions on the property. | Land | Improvement |
|---|---|---|---|---|
| 2024 | $4,998 | $106,720 | $19,180 | $87,540 |
| 2023 | $5,011 | $106,720 | $19,180 | $87,540 |
| 2022 | $3,729 | $70,180 | $12,600 | $57,580 |
| 2021 | $3,750 | $70,180 | $12,600 | $57,580 |
| 2020 | $3,757 | $70,180 | $12,600 | $57,580 |
| 2019 | $2,881 | $59,470 | $9,380 | $50,090 |
| 2018 | $2,912 | $59,470 | $9,380 | $50,090 |
| 2017 | $2,970 | $59,470 | $9,380 | $50,090 |
| 2016 | $2,990 | $55,550 | $8,750 | $46,800 |
| 2015 | $2,825 | $55,550 | $8,750 | $46,800 |
| 2014 | $2,824 | $55,550 | $8,750 | $46,800 |
| 2013 | $2,795 | $54,180 | $8,750 | $45,430 |
Source: Public Records
Map
Nearby Homes
- 96 Amelia Olive Branch Rd
- 4 Gumbert Dr
- 1190 Twin Gate Run
- 41 Wolfer Dr
- 85 Glen Mary Dr
- 14 Broadwood Ln Unit 11D
- 1511 Thornberry Rd
- 3663 Bristol Lake Dr
- 3688 Charter Oak
- 315 Judd Rd
- 1372 Gumbert Dr
- 1529 Creekside Rd
- 57 Marigold Ln
- 3664 Lewis Rd
- 1412 Breckenridge Dr
- 1575 Apple Ct
- 1559 Driftwood Ct
- 61 Goldfish Ln
- 28 Mcarthur Dr
- 1328 Hammann Dr
- 3733 Maplebrooke Ln
- 3731 Maplebrooke Ln
- 3731 Maplebrooke Ln Unit Lt 5
- 3735 Maplebrooke Ln
- 116 Amelia Olive Branch Rd
- 118 Amelia Olive Branch Rd
- 3729 Maplebrooke Ln
- 108 Amelia Olive Branch Rd
- 3737 Maplebrooke Ln
- 118 Amelia-Olive Branch Rd
- 3734 Maplebrooke Ln
- 120 Amelia Olive Branch Rd
- 3732 Maplebrooke Ln
- 104 Amelia Olive Branch Rd
- 3727 Maplebrooke Ln
- 130 Amelia Olive Branch Rd
- 3736 Maplebrooke Ln
- 3739 Maplebrooke Ln
- 3739 Maplebrooke Ln Unit Lt 9
- 105 Amelia-Olive Branch Rd