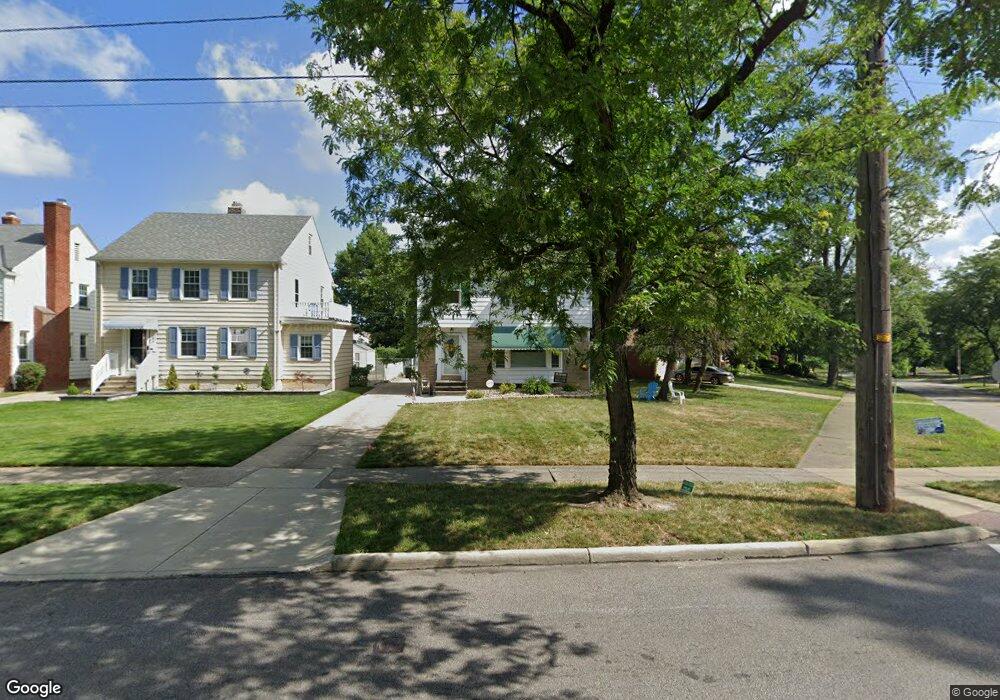
3733 Silsby Rd University Heights, OH 44118
Estimated Value: $217,000 - $243,000
4
Beds
2
Baths
1,590
Sq Ft
$143/Sq Ft
Est. Value
About This Home
This home is located at 3733 Silsby Rd, University Heights, OH 44118 and is currently estimated at $227,316, approximately $142 per square foot. 3733 Silsby Rd is a home located in Cuyahoga County with nearby schools including Gearity Professional Development School, Monticello Middle School, and Cleveland Heights High School.
Ownership History
Date
Name
Owned For
Owner Type
Purchase Details
Closed on
Sep 8, 2009
Sold by
Berggrun Emil S
Bought by
Shepherd April L
Current Estimated Value
Home Financials for this Owner
Home Financials are based on the most recent Mortgage that was taken out on this home.
Original Mortgage
$76,058
Outstanding Balance
$49,943
Interest Rate
5.27%
Mortgage Type
FHA
Estimated Equity
$177,373
Purchase Details
Closed on
Feb 5, 2009
Sold by
Estate Of Sophie Berggrun
Bought by
Berggrun Emil S
Purchase Details
Closed on
Nov 27, 1978
Sold by
Berggrun Emil S and Berggrun Sophie
Bought by
Berggrun Sophie
Purchase Details
Closed on
Jan 1, 1975
Bought by
Berggrun Emil S and Berggrun Sophie
Create a Home Valuation Report for This Property
The Home Valuation Report is an in-depth analysis detailing your home's value as well as a comparison with similar homes in the area
Home Values in the Area
Average Home Value in this Area
Purchase History
| Date | Buyer | Sale Price | Title Company |
|---|---|---|---|
| Shepherd April L | $77,500 | Barristers Title Agency | |
| Berggrun Emil S | -- | None Available | |
| Berggrun Sophie | -- | -- | |
| Berggrun Emil S | -- | -- |
Source: Public Records
Mortgage History
| Date | Status | Borrower | Loan Amount |
|---|---|---|---|
| Open | Shepherd April L | $76,058 |
Source: Public Records
Tax History Compared to Growth
Tax History
| Year | Tax Paid | Tax Assessment Tax Assessment Total Assessment is a certain percentage of the fair market value that is determined by local assessors to be the total taxable value of land and additions on the property. | Land | Improvement |
|---|---|---|---|---|
| 2024 | $6,255 | $72,730 | $11,935 | $60,795 |
| 2023 | $5,189 | $47,010 | $8,470 | $38,540 |
| 2022 | $5,163 | $47,010 | $8,470 | $38,540 |
| 2021 | $5,060 | $47,010 | $8,470 | $38,540 |
| 2020 | $4,995 | $41,970 | $7,560 | $34,410 |
| 2019 | $4,723 | $119,900 | $21,600 | $98,300 |
| 2018 | $3,890 | $41,970 | $7,560 | $34,410 |
| 2017 | $3,260 | $26,570 | $5,990 | $20,580 |
| 2016 | $3,219 | $26,570 | $5,990 | $20,580 |
| 2015 | $2,995 | $26,570 | $5,990 | $20,580 |
| 2014 | $2,995 | $26,040 | $5,880 | $20,160 |
Source: Public Records
Map
Nearby Homes
- 2244 Edgerton Rd
- 2216 Barrington Rd
- 3790 Bushnell Rd
- 3797 Northwood Rd
- 2208 Cranston Rd
- 2232 Fenwick Rd
- 3621 Cedarbrook Rd
- 3841 Washington Blvd
- 3849 Faversham Rd
- 2223 Fenwick Rd
- 2379 Charney Rd
- 13785 Cedar Rd Unit 302
- 2320 Allison Rd
- 3544 Silsby Rd
- 13605 Cedar Rd
- 3705 Meadowbrook Blvd
- 3609 E Scarborough Rd
- 2459 Eaton Rd
- 3850 Colony Rd
- 2448 Charney Rd
- 3729 Silsby Rd
- 2272 Edgerton Rd
- 3725 Silsby Rd
- 2259 Barrington Rd
- 3721
- 3721 Silsby Rd
- 2255 Barrington Rd
- 2264 Edgerton Rd
- 2251 Barrington Rd
- 2260 Edgerton Rd
- 2267 Edgerton Rd
- 3742 Silsby Rd
- 3734 Silsby Rd
- 3730 Silsby Rd
- 3730 Silsby Rd Unit 1
- 3746 Silsby Rd
- 2263 Edgerton Rd
- 2256 Edgerton Rd
- 3709 Silsby Rd
- 3726 Silsby Rd