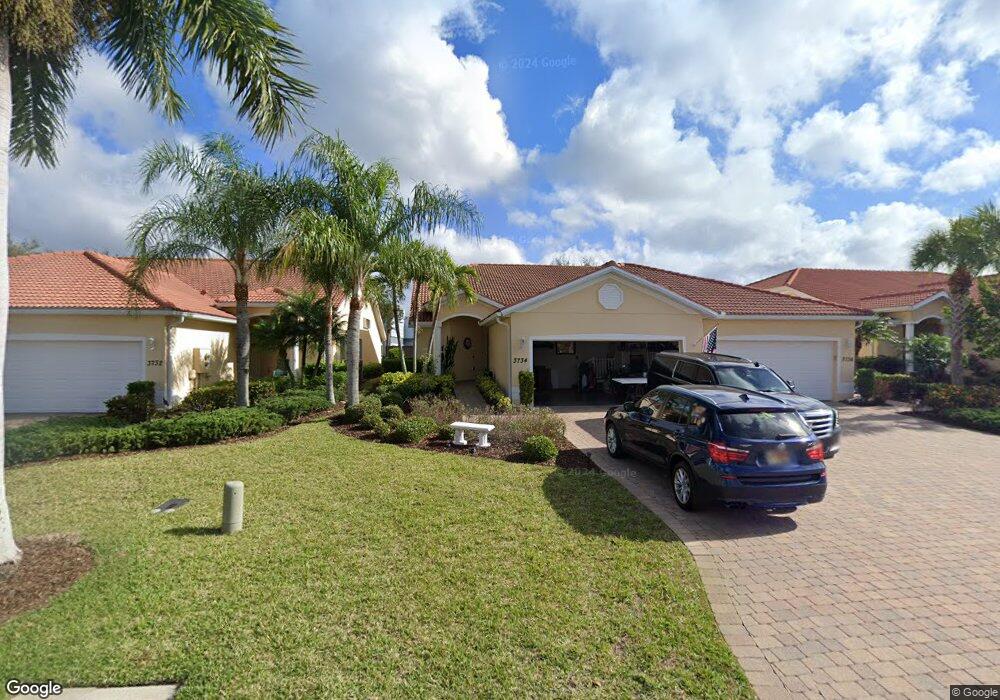
3734 Albacete Cir Unit 16UNIT31 Punta Gorda, FL 33950
Burnt Store Isles NeighborhoodEstimated Value: $250,000 - $313,000
3
Beds
2
Baths
1,765
Sq Ft
$156/Sq Ft
Est. Value
About This Home
This home is located at 3734 Albacete Cir Unit 16UNIT31, Punta Gorda, FL 33950 and is currently estimated at $275,889, approximately $156 per square foot. 3734 Albacete Cir Unit 16UNIT31 is a home located in Charlotte County with nearby schools including Sallie Jones Elementary School, Punta Gorda Middle School, and Charlotte High School.
Ownership History
Date
Name
Owned For
Owner Type
Purchase Details
Closed on
Aug 7, 2020
Sold by
Hanley Darcy R and Wood Bryan K
Bought by
Wood Bryan K and Hanley Darcy R
Current Estimated Value
Purchase Details
Closed on
Jun 19, 2017
Sold by
Mogan James V and Mogan Patricia
Bought by
Hanley Darcy R and Wood Bryan K
Home Financials for this Owner
Home Financials are based on the most recent Mortgage that was taken out on this home.
Original Mortgage
$161,600
Outstanding Balance
$134,528
Interest Rate
4.05%
Mortgage Type
New Conventional
Estimated Equity
$141,361
Purchase Details
Closed on
Sep 20, 2007
Sold by
Charlotte Isles Development Llc
Bought by
Mogan James V and Mogan Patricia
Home Financials for this Owner
Home Financials are based on the most recent Mortgage that was taken out on this home.
Original Mortgage
$150,000
Interest Rate
6.25%
Mortgage Type
Purchase Money Mortgage
Create a Home Valuation Report for This Property
The Home Valuation Report is an in-depth analysis detailing your home's value as well as a comparison with similar homes in the area
Home Values in the Area
Average Home Value in this Area
Purchase History
| Date | Buyer | Sale Price | Title Company |
|---|---|---|---|
| Wood Bryan K | -- | Attorney | |
| Hanley Darcy R | $202,000 | Burnt Store Title & Escrow L | |
| Mogan James V | $311,300 | Beachfront Title Ins Inc |
Source: Public Records
Mortgage History
| Date | Status | Borrower | Loan Amount |
|---|---|---|---|
| Open | Hanley Darcy R | $161,600 | |
| Previous Owner | Mogan James V | $150,000 |
Source: Public Records
Tax History Compared to Growth
Tax History
| Year | Tax Paid | Tax Assessment Tax Assessment Total Assessment is a certain percentage of the fair market value that is determined by local assessors to be the total taxable value of land and additions on the property. | Land | Improvement |
|---|---|---|---|---|
| 2023 | $2,577 | $191,792 | $0 | $0 |
| 2022 | $2,498 | $186,206 | $0 | $0 |
| 2021 | $2,472 | $180,783 | $0 | $0 |
| 2020 | $2,379 | $178,287 | $0 | $0 |
| 2019 | $2,340 | $174,279 | $0 | $0 |
| 2018 | $2,141 | $171,029 | $0 | $171,029 |
| 2017 | $2,658 | $165,028 | $0 | $0 |
| 2016 | $2,542 | $141,985 | $0 | $0 |
| 2015 | $2,351 | $129,077 | $0 | $0 |
| 2014 | $2,090 | $117,343 | $0 | $0 |
Source: Public Records
Map
Nearby Homes
- 3715 Albacete Cir Unit 93
- 3743 Albacete Cir Unit 84
- 3748 Albacete Cir Unit 38
- 3723 Tripoli Blvd
- 323 Monaco Dr Unit 10
- 317 Monaco Dr Unit 7
- 327 Monaco Dr Unit 12
- 3427 Tripoli Blvd
- 3762 Tripoli Blvd Unit 21
- 3324 Tripoli Blvd
- 3554 Mondovi Ct
- 3548 Mondovi Ct
- 3542 Mondovi Ct
- 3537 Mondovi Ct
- 3536 Mondovi Ct
- 3560 Mondovi Ct
- 3736 Bordeaux Dr
- 3628 Licata Ct
- 3701 Bordeaux Dr
- 3880 Bordeaux Dr
- 3734 Albacete Cir Unit 31
- 3736 Albacete Cir Unit 32
- 3736 Albacete Cir Unit 16UNIT32
- 3732 Albacete Cir Unit 15UNIT30
- 3732 Albacete Cir Unit 30
- 3730 Albacete Cir Unit 29
- 3730 Albacete Cir Unit 15UNIT29
- 3740 Albacete Cir Unit 34
- 3728 Albacete Cir Unit 3728
- 3728 Albacete Cir Unit 28
- 3728 Albacete Cir Unit 14UNIT28
- 3726 Albacete Cir Unit 14UNIT27
- 3726 Albacete Cir Unit 27
- 3724 Albacete Cir
- 3724 Albacete Cir Unit 26
- 3721 Albacete Cir Unit 91
- 3721 Albacete Cir Unit 46UNIT9
- 3719 Albacete Cir Unit 46UNIT92
- 3719 Albacete Cir Unit 92
- 3715 Albacete Cir