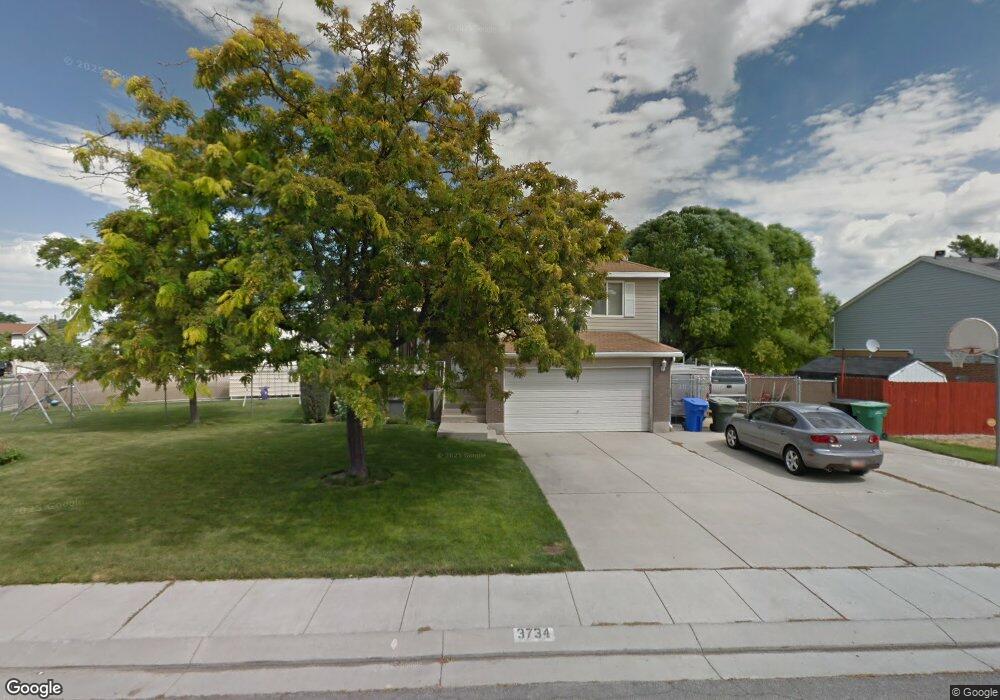
3734 W 8850 S West Jordan, UT 84088
Jordan Oaks NeighborhoodEstimated Value: $470,567 - $622,000
3
Beds
1
Bath
1,280
Sq Ft
$414/Sq Ft
Est. Value
About This Home
This home is located at 3734 W 8850 S, West Jordan, UT 84088 and is currently estimated at $529,392, approximately $413 per square foot. 3734 W 8850 S is a home located in Salt Lake County with nearby schools including Terra Linda Elementary School, Joel P. Jensen Middle School, and West Jordan High School.
Ownership History
Date
Name
Owned For
Owner Type
Purchase Details
Closed on
Aug 20, 2019
Sold by
Whitney Callie K and Whitney Jason B
Bought by
Whitney Callie K and Whitney Jason B
Current Estimated Value
Home Financials for this Owner
Home Financials are based on the most recent Mortgage that was taken out on this home.
Original Mortgage
$33,100
Outstanding Balance
$29,049
Interest Rate
3.8%
Mortgage Type
Credit Line Revolving
Estimated Equity
$500,343
Purchase Details
Closed on
Mar 24, 2017
Sold by
Olson Callie K
Bought by
Olson Callie K and Whitney Jason B
Home Financials for this Owner
Home Financials are based on the most recent Mortgage that was taken out on this home.
Original Mortgage
$252,345
Outstanding Balance
$203,691
Interest Rate
3.25%
Mortgage Type
FHA
Estimated Equity
$325,701
Purchase Details
Closed on
Jul 9, 2001
Sold by
Nelsen Dyke S and Nelsen Julie F
Bought by
Nelsen Dyke S and Nelsen Julie Frey
Create a Home Valuation Report for This Property
The Home Valuation Report is an in-depth analysis detailing your home's value as well as a comparison with similar homes in the area
Home Values in the Area
Average Home Value in this Area
Purchase History
| Date | Buyer | Sale Price | Title Company |
|---|---|---|---|
| Whitney Callie K | -- | First American Title | |
| Olson Callie K | -- | Keystone Title Ins Agcy Llc | |
| Olson Callie K | -- | Pinnacle Title Co | |
| Nelsen Dyke S | -- | First American Title |
Source: Public Records
Mortgage History
| Date | Status | Borrower | Loan Amount |
|---|---|---|---|
| Open | Whitney Callie K | $33,100 | |
| Open | Olson Callie K | $252,345 |
Source: Public Records
Tax History Compared to Growth
Tax History
| Year | Tax Paid | Tax Assessment Tax Assessment Total Assessment is a certain percentage of the fair market value that is determined by local assessors to be the total taxable value of land and additions on the property. | Land | Improvement |
|---|---|---|---|---|
| 2025 | $2,349 | $454,700 | $150,100 | $304,600 |
| 2024 | $2,349 | $452,000 | $148,600 | $303,400 |
| 2023 | $2,318 | $420,300 | $145,700 | $274,600 |
| 2022 | $2,399 | $428,000 | $142,800 | $285,200 |
| 2021 | $2,065 | $335,400 | $98,500 | $236,900 |
| 2020 | $1,685 | $256,800 | $80,800 | $176,000 |
| 2019 | $1,692 | $252,800 | $80,800 | $172,000 |
| 2018 | $1,562 | $231,500 | $78,600 | $152,900 |
| 2017 | $1,470 | $216,900 | $78,600 | $138,300 |
| 2016 | $1,453 | $201,400 | $78,600 | $122,800 |
| 2015 | $1,409 | $190,500 | $80,100 | $110,400 |
| 2014 | $1,347 | $179,300 | $76,400 | $102,900 |
Source: Public Records
Map
Nearby Homes
- 8983 S 3860 W
- 3888 W 8700 S
- 3931 W Dansere Cir
- 8461 S Meadowlark Ln
- 3750 W Bingham Creek Dr
- 8400 S 4000 W Unit 134
- 3214 W Monterey Pine Ln
- 8941 S Sun Leaf Dr
- 3702 W Angus Dr
- 9441 S Newkirk St
- 9375 S Laurel Ridge Cir
- 8493 S 3200 W
- 3977 W Elwood Way
- 2990 W 8870 S
- 8180 S Old Bingham Hwy
- 9526 Ember Glow Ct Unit C
- 2970 W 8870 S
- 9029 S Ripple Dr
- 9566 Ember Glow Ct Unit C
- 3112 Green Acre Dr