Estimated Value: $579,000 - $595,270
4
Beds
3
Baths
3,254
Sq Ft
$180/Sq Ft
Est. Value
About This Home
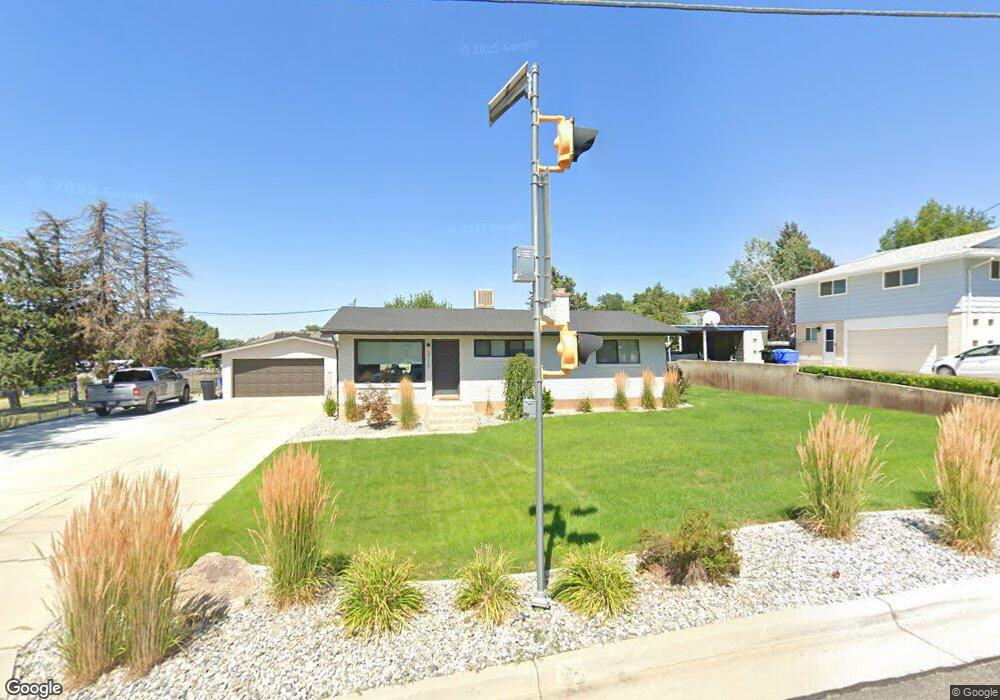
This home is located at 3735 N 900 W, Ogden, UT 84414 and is currently estimated at $586,818, approximately $180 per square foot. 3735 N 900 W is a home located in Weber County with nearby schools including Lomond View School, Orion Junior High School, and Weber High School.
Ownership History
Date
Name
Owned For
Owner Type
Purchase Details
Closed on
Nov 14, 2024
Sold by
Monson Patrick B and Monson Karalee
Bought by
Gayle L Allen Trust and Allen
Current Estimated Value
Purchase Details
Closed on
Jul 1, 2019
Sold by
Bailey Gloria Ann and Malmberg Janet Lee B
Bought by
Monson Patrick B and Monson Karalee
Home Financials for this Owner
Home Financials are based on the most recent Mortgage that was taken out on this home.
Original Mortgage
$240,000
Interest Rate
4%
Mortgage Type
New Conventional
Purchase Details
Closed on
Jun 20, 2019
Sold by
Laughter Delone L
Bought by
Bailey Gloria Ann and Malmberg Janet Lee B
Home Financials for this Owner
Home Financials are based on the most recent Mortgage that was taken out on this home.
Original Mortgage
$240,000
Interest Rate
4%
Mortgage Type
New Conventional
Create a Home Valuation Report for This Property
The Home Valuation Report is an in-depth analysis detailing your home's value as well as a comparison with similar homes in the area
Home Values in the Area
Average Home Value in this Area
Purchase History
| Date | Buyer | Sale Price | Title Company |
|---|---|---|---|
| Gayle L Allen Trust | -- | Old Republic Title | |
| Gayle L Allen Trust | -- | Old Republic Title | |
| Monson Patrick B | -- | First Amer Fashion Pointe | |
| Bailey Gloria Ann | -- | First Amer Fashion Pointe |
Source: Public Records
Mortgage History
| Date | Status | Borrower | Loan Amount |
|---|---|---|---|
| Previous Owner | Monson Patrick B | $240,000 |
Source: Public Records
Tax History Compared to Growth
Tax History
| Year | Tax Paid | Tax Assessment Tax Assessment Total Assessment is a certain percentage of the fair market value that is determined by local assessors to be the total taxable value of land and additions on the property. | Land | Improvement |
|---|---|---|---|---|
| 2025 | $3,235 | $490,299 | $150,046 | $340,253 |
| 2024 | $3,127 | $265,099 | $82,525 | $182,574 |
| 2023 | $3,013 | $257,400 | $82,499 | $174,901 |
| 2022 | $2,920 | $255,750 | $79,751 | $175,999 |
| 2021 | $2,468 | $362,000 | $125,001 | $236,999 |
| 2020 | $2,278 | $307,000 | $110,198 | $196,802 |
| 2019 | $2,165 | $277,000 | $110,198 | $166,802 |
| 2018 | $2,026 | $247,000 | $64,978 | $182,022 |
| 2017 | $1,900 | $217,000 | $64,978 | $152,022 |
| 2016 | $1,770 | $109,587 | $35,738 | $73,849 |
| 2015 | $1,774 | $109,178 | $35,738 | $73,440 |
| 2014 | $1,620 | $96,584 | $35,738 | $60,846 |
Source: Public Records
Map
Nearby Homes