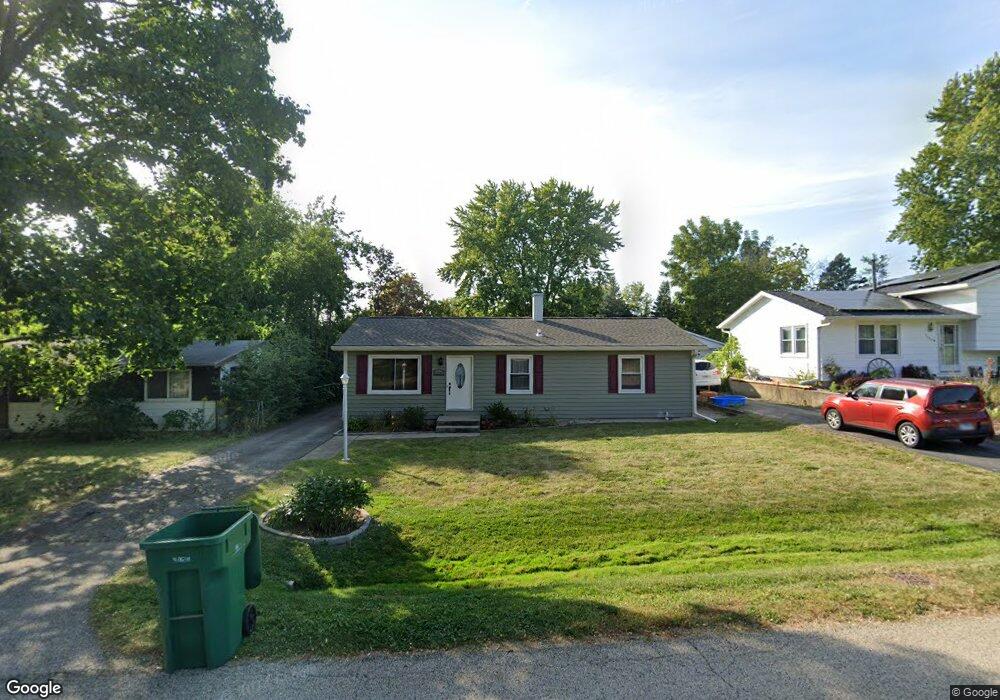
37356 N Fairview Ln Unit 3 Lake Villa, IL 60046
Fox Lake Hills NeighborhoodEstimated Value: $207,000 - $284,722
4
Beds
2
Baths
1,056
Sq Ft
$237/Sq Ft
Est. Value
About This Home
This home is located at 37356 N Fairview Ln Unit 3, Lake Villa, IL 60046 and is currently estimated at $250,681, approximately $237 per square foot. 37356 N Fairview Ln Unit 3 is a home located in Lake County with nearby schools including Gavin Central Elementary School, Gavin South Middle School, and Grant Community High School.
Ownership History
Date
Name
Owned For
Owner Type
Purchase Details
Closed on
Aug 29, 2011
Sold by
Wells Fargo Bank N A
Bought by
Lee Matthew W and Allen Susan B
Current Estimated Value
Home Financials for this Owner
Home Financials are based on the most recent Mortgage that was taken out on this home.
Original Mortgage
$95,027
Interest Rate
3.75%
Mortgage Type
FHA
Purchase Details
Closed on
Apr 6, 2011
Sold by
Fox Jennifer and Fox Francis
Bought by
Wachovia Mortgage Corporation
Purchase Details
Closed on
Jul 15, 1999
Sold by
Gapinski Richard J and Gapinski Julie A
Bought by
Fox Francis W and Fox Jennifer L
Home Financials for this Owner
Home Financials are based on the most recent Mortgage that was taken out on this home.
Original Mortgage
$124,999
Interest Rate
7.43%
Mortgage Type
FHA
Create a Home Valuation Report for This Property
The Home Valuation Report is an in-depth analysis detailing your home's value as well as a comparison with similar homes in the area
Home Values in the Area
Average Home Value in this Area
Purchase History
| Date | Buyer | Sale Price | Title Company |
|---|---|---|---|
| Lee Matthew W | $97,500 | First American Title | |
| Wachovia Mortgage Corporation | -- | None Available | |
| Fox Francis W | $126,500 | -- |
Source: Public Records
Mortgage History
| Date | Status | Borrower | Loan Amount |
|---|---|---|---|
| Previous Owner | Lee Matthew W | $95,027 | |
| Previous Owner | Fox Francis W | $124,999 |
Source: Public Records
Tax History Compared to Growth
Tax History
| Year | Tax Paid | Tax Assessment Tax Assessment Total Assessment is a certain percentage of the fair market value that is determined by local assessors to be the total taxable value of land and additions on the property. | Land | Improvement |
|---|---|---|---|---|
| 2024 | $5,155 | $79,895 | $12,136 | $67,759 |
| 2023 | $4,929 | $70,591 | $10,723 | $59,868 |
| 2022 | $4,929 | $64,048 | $10,597 | $53,451 |
| 2021 | $4,672 | $59,497 | $9,844 | $49,653 |
| 2020 | $4,598 | $57,591 | $9,529 | $48,062 |
| 2019 | $4,464 | $55,349 | $9,158 | $46,191 |
| 2018 | $4,001 | $50,745 | $10,240 | $40,505 |
| 2017 | $3,854 | $49,392 | $9,967 | $39,425 |
| 2016 | $4,530 | $47,392 | $9,563 | $37,829 |
| 2015 | $4,680 | $44,263 | $8,932 | $35,331 |
| 2014 | $2,919 | $32,018 | $10,610 | $21,408 |
| 2012 | $2,712 | $32,172 | $10,661 | $21,511 |
Source: Public Records
Map
Nearby Homes
- 37322 N Stanton Point Rd
- 36497 N Hawthorne Ln
- 25164 W Sunset Ln
- 36391 N Tamarack Dr
- 25216 W Buena Ave
- 913 Amber Ln
- 908 Amber Ln
- 36379 N Wesley Rd
- 24570 W Blackcherry Ln
- 802 Apache Trail
- 25058 Megan Ct
- 26633 W Astor St
- 38871 N Lakeview Ave
- 35835 N Benjamin Ave
- 24731 W Orchard Place
- 38815 N Broadway Ave
- 2292 Iroquois Ln
- 35720 N Laurel Ave
- 35694 N Laurel Ave
- 862 Chesapeake Trail
- 37346 N Fairview Ln
- 37368 N Fairview Ln Unit 3
- 37382 N Fairview Ln
- 37338 N Fairview Ln
- 37361 N Il Route 59 Unit 3
- 37393 N Il Route 59
- 37361 N Illinois 59
- 37393 N Route 59
- 37326 N Fairview Ln
- 25343 W Arcade Dr N
- 25323 W Fairview Cir
- 37377 N Fairview Ln
- 37400 N Fairview Ln
- 37341 N Il Route 59
- 37353 N Il Route 59
- 37314 N Fairview Ln
- 37411 N Il Route 59
- 37309 N Fairview Ln
- 25309 W Fairview Cir
- 37327 N Il Route 59