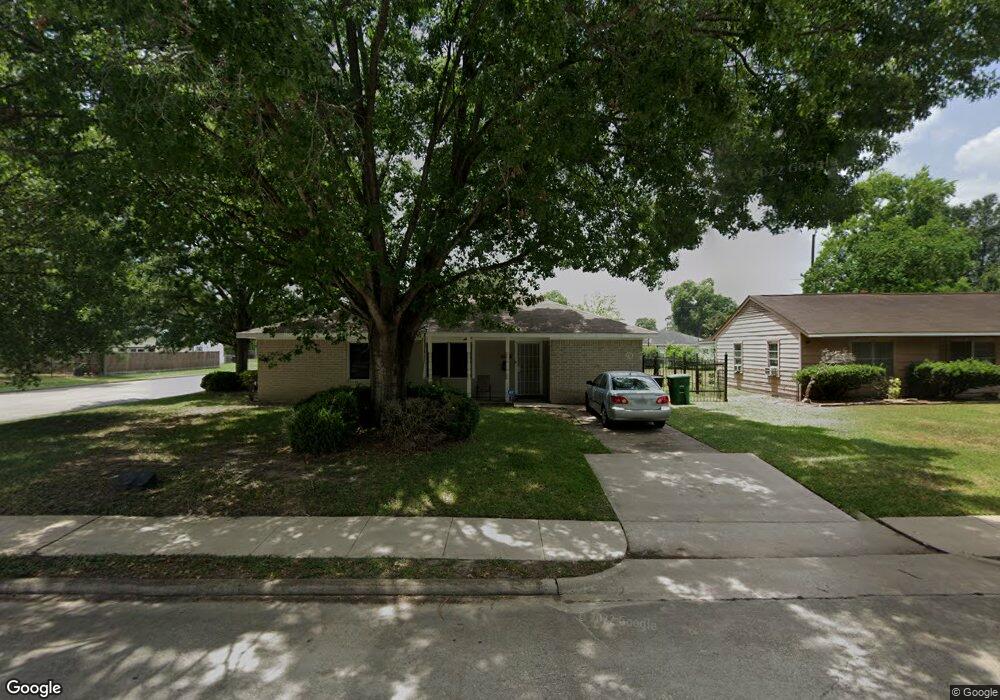
3736 Cosby St Houston, TX 77021
OST-South Union NeighborhoodEstimated Value: $222,561 - $281,000
2
Beds
3
Baths
1,635
Sq Ft
$153/Sq Ft
Est. Value
About This Home
This home is located at 3736 Cosby St, Houston, TX 77021 and is currently estimated at $249,890, approximately $152 per square foot. 3736 Cosby St is a home located in Harris County with nearby schools including Thompson Elementary School, Cullen Middle School, and Yates High School.
Ownership History
Date
Name
Owned For
Owner Type
Purchase Details
Closed on
Jan 28, 2021
Sold by
Porche Vivian L Harris
Bought by
Reed Winston and 3736 Cosby Land Trust
Current Estimated Value
Purchase Details
Closed on
Aug 4, 2017
Sold by
Parker Edie
Bought by
Harris Lafrance C
Purchase Details
Closed on
Sep 8, 2015
Sold by
Rogers Berry and Rogers Wilma Edna
Bought by
Parker Eddie
Create a Home Valuation Report for This Property
The Home Valuation Report is an in-depth analysis detailing your home's value as well as a comparison with similar homes in the area
Home Values in the Area
Average Home Value in this Area
Purchase History
| Date | Buyer | Sale Price | Title Company |
|---|---|---|---|
| Reed Winston | -- | None Available | |
| Porche Vivian L Harris | -- | None Available | |
| Porche Vivian L Harris | -- | None Available | |
| Harris Lafrance C | -- | None Available | |
| Parker Eddie | $60,200 | None Available |
Source: Public Records
Tax History Compared to Growth
Tax History
| Year | Tax Paid | Tax Assessment Tax Assessment Total Assessment is a certain percentage of the fair market value that is determined by local assessors to be the total taxable value of land and additions on the property. | Land | Improvement |
|---|---|---|---|---|
| 2025 | $4,440 | $223,348 | $130,638 | $92,710 |
| 2024 | $4,440 | $212,187 | $125,039 | $87,148 |
| 2023 | $4,440 | $258,505 | $119,440 | $139,065 |
| 2022 | $4,558 | $206,998 | $97,045 | $109,953 |
| 2021 | $4,139 | $177,594 | $52,255 | $125,339 |
| 2020 | $3,635 | $150,122 | $52,255 | $97,867 |
| 2019 | $4,004 | $158,222 | $41,058 | $117,164 |
| 2018 | $2,344 | $143,872 | $33,593 | $110,279 |
| 2017 | $2,933 | $116,011 | $33,593 | $82,418 |
| 2016 | $2,511 | $99,315 | $22,395 | $76,920 |
| 2015 | $40 | $92,454 | $20,529 | $71,925 |
| 2014 | $40 | $90,889 | $20,529 | $70,360 |
Source: Public Records
Map
Nearby Homes