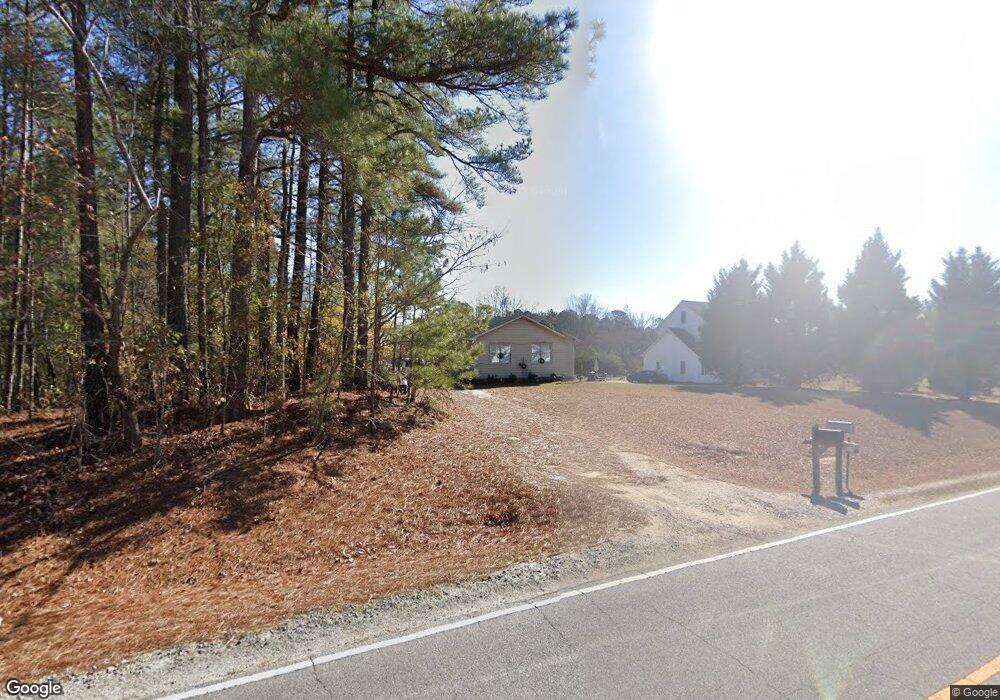
3736 Edgemont Rd Wendell, NC 27591
Estimated Value: $183,000 - $228,000
2
Beds
1
Bath
977
Sq Ft
$206/Sq Ft
Est. Value
About This Home
This home is located at 3736 Edgemont Rd, Wendell, NC 27591 and is currently estimated at $201,684, approximately $206 per square foot. 3736 Edgemont Rd is a home located in Wake County with nearby schools including Lockhart Elementary School, Neuse River Middle School, and East Wake High School.
Ownership History
Date
Name
Owned For
Owner Type
Purchase Details
Closed on
Aug 11, 2014
Sold by
Sumpter Deshele and Sumpter Fred J
Bought by
Perry Howard J and Perry Karen
Current Estimated Value
Home Financials for this Owner
Home Financials are based on the most recent Mortgage that was taken out on this home.
Original Mortgage
$61,224
Outstanding Balance
$46,822
Interest Rate
4.19%
Mortgage Type
FHA
Estimated Equity
$154,862
Purchase Details
Closed on
Aug 29, 2008
Sold by
United States Of America
Bought by
Sumpter Deshele and Hodge Emma
Purchase Details
Closed on
Nov 5, 1997
Sold by
Lawrence L Brent
Bought by
Hodge Kattie J
Home Financials for this Owner
Home Financials are based on the most recent Mortgage that was taken out on this home.
Original Mortgage
$2,400
Interest Rate
7.31%
Mortgage Type
Seller Take Back
Create a Home Valuation Report for This Property
The Home Valuation Report is an in-depth analysis detailing your home's value as well as a comparison with similar homes in the area
Home Values in the Area
Average Home Value in this Area
Purchase History
| Date | Buyer | Sale Price | Title Company |
|---|---|---|---|
| Perry Howard J | $60,000 | None Available | |
| Sumpter Deshele | $37,500 | None Available | |
| Hodge Kattie J | $8,500 | -- |
Source: Public Records
Mortgage History
| Date | Status | Borrower | Loan Amount |
|---|---|---|---|
| Open | Perry Howard J | $61,224 | |
| Previous Owner | Hodge Kattie J | $2,400 |
Source: Public Records
Tax History Compared to Growth
Tax History
| Year | Tax Paid | Tax Assessment Tax Assessment Total Assessment is a certain percentage of the fair market value that is determined by local assessors to be the total taxable value of land and additions on the property. | Land | Improvement |
|---|---|---|---|---|
| 2025 | $998 | $152,917 | $45,000 | $107,917 |
| 2024 | $970 | $152,917 | $45,000 | $107,917 |
| 2023 | $849 | $106,278 | $34,000 | $72,278 |
| 2022 | $788 | $106,278 | $34,000 | $72,278 |
| 2021 | $767 | $106,278 | $34,000 | $72,278 |
| 2020 | $754 | $106,278 | $34,000 | $72,278 |
| 2019 | $661 | $78,436 | $24,000 | $54,436 |
| 2018 | $609 | $78,436 | $24,000 | $54,436 |
| 2017 | $578 | $78,436 | $24,000 | $54,436 |
| 2016 | $566 | $78,436 | $24,000 | $54,436 |
| 2015 | $711 | $99,547 | $40,000 | $59,547 |
| 2014 | $675 | $99,547 | $40,000 | $59,547 |
Source: Public Records
Map
Nearby Homes
- 7117 Brodie Alston Ln
- 0 Hodge Rd
- 6905 Buck Rd
- 3541 Holden Acres Dr
- 8.78 Acres Riley Hill Rd
- 2700 Stevie Dr
- 3816 Standing Pine Ln
- 3829 Standing Pine Ln
- 3828 Standing Pine Ln
- 0 Jones Cousins Way
- 2909 Dureamer Dr
- 0 Lizard Lick Rd
- 6600 Sadie Dr
- 7612 Mitchell Mill Rd
- 7616 Mitchell Mill Rd
- 2500 Davistown Rd
- 9520 Wood River Dr
- 5725 All Clear Ln
- 2804 Jack Mitchell Rd
- 5833 Mitchell Mill Rd
- 3730 Edgemont Rd
- 3805 Edgemont Rd
- 3812 Edgemont Rd
- 3816 Edgemont Rd
- 3716 Edgemont Rd
- 3720 Edgemont Rd
- 3708 Edgemont Rd
- 3901 Edgemont Rd
- 3907 Edgemont Rd
- 3900 Edgemont Rd
- 3837 Edgemont Rd
- 3701 Edgemont Rd
- 3821 Edgemont Rd
- 3825 Edgemont Rd
- 3636 Edgemont Rd
- 3913 Edgemont Rd
- 3632 Edgemont Rd
- 3919 Edgemont Rd
- 3917 Edgemont Rd
- 3628 Edgemont Rd