3737 SE Horstman Rd Port Orchard, WA 98366
Parkwood NeighborhoodEstimated Value: $481,000 - $578,000
2
Beds
2
Baths
1,315
Sq Ft
$392/Sq Ft
Est. Value
About This Home
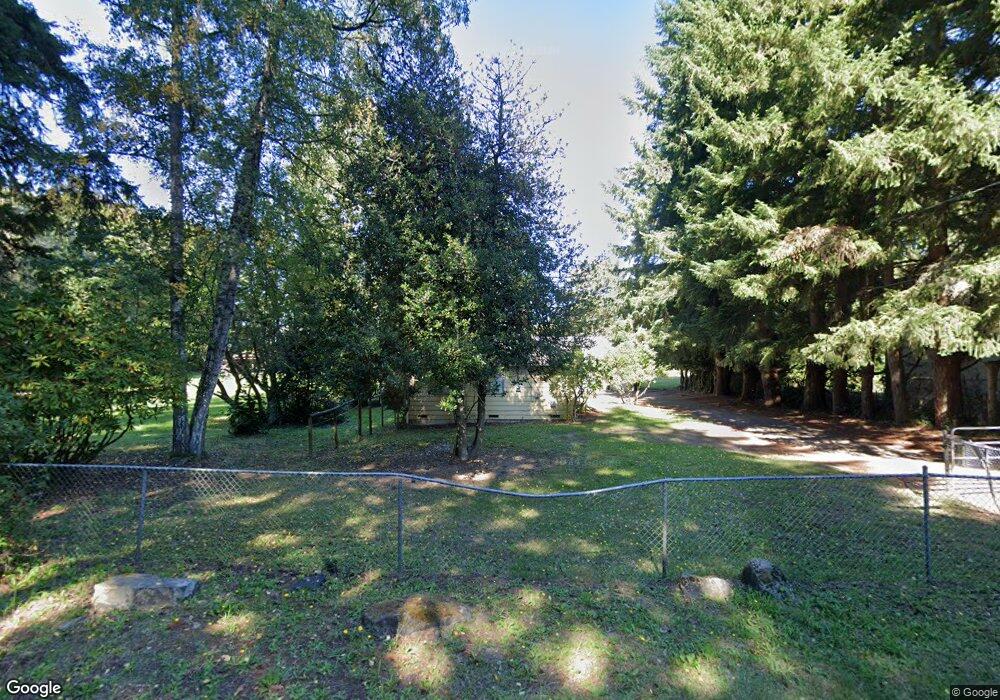
This home is located at 3737 SE Horstman Rd, Port Orchard, WA 98366 and is currently estimated at $514,954, approximately $391 per square foot. 3737 SE Horstman Rd is a home located in Kitsap County with nearby schools including Orchard Heights Elementary School, Marcus Whitman Middle School, and South Kitsap High School.
Ownership History
Date
Name
Owned For
Owner Type
Purchase Details
Closed on
Jul 28, 2011
Sold by
Chandler Richard
Bought by
Chandler Paula
Current Estimated Value
Purchase Details
Closed on
Apr 8, 2009
Sold by
Chandler Paula and Ferguson Paula J
Bought by
Chandler Paula and Chandler Richard P
Home Financials for this Owner
Home Financials are based on the most recent Mortgage that was taken out on this home.
Original Mortgage
$165,000
Interest Rate
4.99%
Mortgage Type
Stand Alone Second
Purchase Details
Closed on
Nov 19, 1998
Sold by
Isbell Thomas and Isbell Nancy
Bought by
Perguson Paula J
Home Financials for this Owner
Home Financials are based on the most recent Mortgage that was taken out on this home.
Original Mortgage
$98,000
Interest Rate
6.84%
Create a Home Valuation Report for This Property
The Home Valuation Report is an in-depth analysis detailing your home's value as well as a comparison with similar homes in the area
Home Values in the Area
Average Home Value in this Area
Purchase History
| Date | Buyer | Sale Price | Title Company |
|---|---|---|---|
| Chandler Paula | $84,438 | None Available | |
| Chandler Paula | -- | None Available | |
| Perguson Paula J | $140,000 | Land Title Company |
Source: Public Records
Mortgage History
| Date | Status | Borrower | Loan Amount |
|---|---|---|---|
| Previous Owner | Chandler Paula | $165,000 | |
| Previous Owner | Perguson Paula J | $98,000 |
Source: Public Records
Tax History Compared to Growth
Tax History
| Year | Tax Paid | Tax Assessment Tax Assessment Total Assessment is a certain percentage of the fair market value that is determined by local assessors to be the total taxable value of land and additions on the property. | Land | Improvement |
|---|---|---|---|---|
| 2026 | $3,629 | $471,470 | $180,470 | $291,000 |
| 2025 | $3,629 | $411,390 | $135,170 | $276,220 |
| 2024 | $3,520 | $411,390 | $135,170 | $276,220 |
| 2023 | $3,496 | $411,390 | $135,170 | $276,220 |
| 2022 | $3,552 | $350,670 | $126,230 | $224,440 |
| 2021 | $3,414 | $318,930 | $117,300 | $201,630 |
| 2020 | $3,360 | $305,120 | $111,710 | $193,410 |
| 2019 | $2,905 | $289,160 | $136,400 | $152,760 |
| 2018 | $3,186 | $254,710 | $136,400 | $118,310 |
| 2017 | $2,813 | $254,710 | $136,400 | $118,310 |
| 2016 | $2,878 | $238,740 | $136,400 | $102,340 |
| 2015 | $2,810 | $236,220 | $136,400 | $99,820 |
| 2014 | -- | $233,700 | $136,400 | $97,300 |
| 2013 | -- | $248,010 | $152,180 | $95,830 |
Source: Public Records
Map
Nearby Homes
- 0 Wendell Ave SE
- 740 Tufts Ave E
- 4010 SE Lovell St
- 1663 Harrison Ave SE
- 3900 SE Mile Hill Dr
- 3930 SE Mile Hill Dr
- 4258 SE Woodford Ct
- 1242 Lidstrom Rd E
- 4990 Mile Hill Dr
- 2949 SE Mile Hill Dr Unit C7
- 2949 SE Mile Hill Dr Unit C-2
- 2017 SE Juniper Ct
- 1355 Ahlstrom Rd E
- 3140 E Washington St
- 2014 Kelowna Place SE
- 1108 Olney Ave E
- 0 E Washington St Unit NWM2337936
- 22 Lots E Washington St
- 123 E 4th St
- 2116 Pine Tree Dr SE
- 3566 E Calistoga Ct
- 3560 E Calistoga Ct
- 3572 E Calistoga Ct
- 3554 E Calistoga Ct
- 3678 SE Horstman Rd
- 3686 SE Horstman Rd
- 3578 E Calistoga Ct
- 3665 SE Orlando St
- 3548 E Calistoga Ct
- 3745 SE Horstman Rd
- 3584 E Calistoga Ct
- 3553 E Calistoga Ct
- 3573 E Calistoga Ct
- 3817 SE Horstman Rd
- 3817 SE Horstman Rd
- 3635 SE Orlando St
- 0 Russell Ave SE Unit NWM1996603
- 3579 E Calistoga Ct
- 3547 E Calistoga Ct
- 3732 SE Horstman Rd