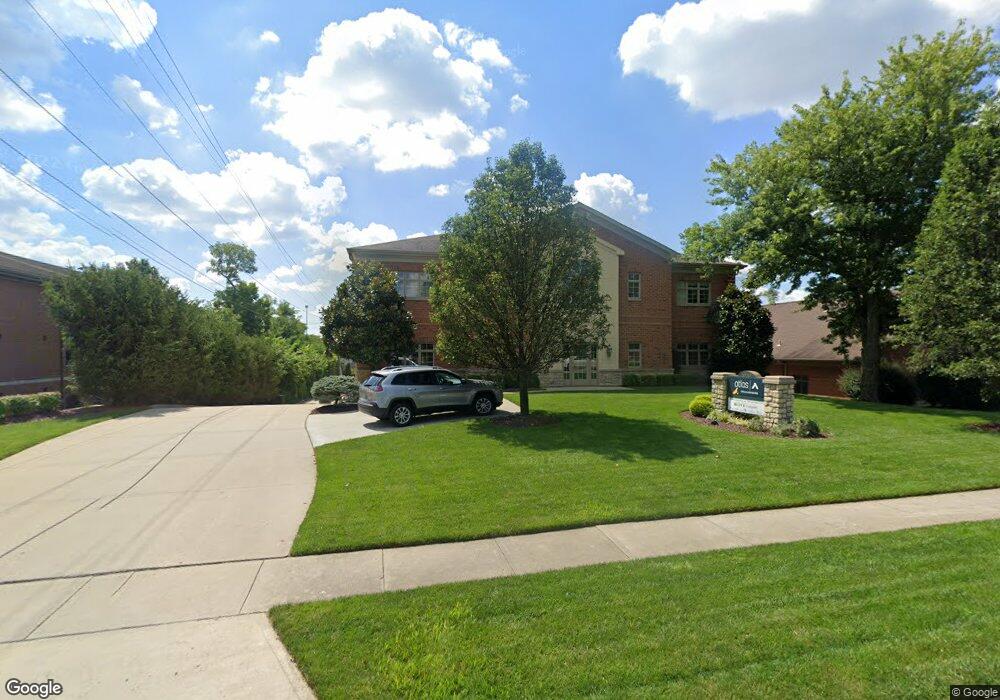
3737 W Fork Rd Cincinnati, OH 45247
West Monfort Heights Neighborhood
4
Beds
2
Baths
1,500
Sq Ft
0.81
Acres
About This Home
This home is located at 3737 W Fork Rd, Cincinnati, OH 45247. 3737 W Fork Rd is a home located in Hamilton County with nearby schools including Monfort Heights Elementary School, White Oak Middle School, and Colerain High School.
Ownership History
Date
Name
Owned For
Owner Type
Purchase Details
Closed on
May 12, 2006
Sold by
Johnson Investment Counsel Inc
Bought by
Rueve Investments Llc
Purchase Details
Closed on
Feb 4, 2002
Sold by
Johnson Investment Counsel Inc
Bought by
Johnson Investment Counsel Inc
Purchase Details
Closed on
Oct 1, 2001
Sold by
Psl Associates Ltd Partnership
Bought by
Nria Inc
Home Financials for this Owner
Home Financials are based on the most recent Mortgage that was taken out on this home.
Original Mortgage
$15,500,000
Interest Rate
6.99%
Mortgage Type
Credit Line Revolving
Purchase Details
Closed on
Apr 3, 2000
Sold by
Tedford David C
Bought by
Psl Associates Ltd Partnership
Create a Home Valuation Report for This Property
The Home Valuation Report is an in-depth analysis detailing your home's value as well as a comparison with similar homes in the area
Home Values in the Area
Average Home Value in this Area
Purchase History
| Date | Buyer | Sale Price | Title Company |
|---|---|---|---|
| Rueve Investments Llc | $177,000 | None Available | |
| Johnson Investment Counsel Inc | -- | -- | |
| Nria Inc | $3,501,900 | -- | |
| Psl Associates Ltd Partnership | -- | -- |
Source: Public Records
Mortgage History
| Date | Status | Borrower | Loan Amount |
|---|---|---|---|
| Previous Owner | Nria Inc | $15,500,000 |
Source: Public Records
Tax History
| Year | Tax Paid | Tax Assessment Tax Assessment Total Assessment is a certain percentage of the fair market value that is determined by local assessors to be the total taxable value of land and additions on the property. | Land | Improvement |
|---|---|---|---|---|
| 2025 | $23,104 | $302,281 | $49,203 | $253,078 |
| 2024 | $23,075 | $302,281 | $49,203 | $253,078 |
| 2023 | $22,740 | $302,281 | $49,203 | $253,078 |
| 2022 | $23,950 | $278,293 | $46,057 | $232,236 |
| 2021 | $22,717 | $278,293 | $46,057 | $232,236 |
| 2020 | $22,409 | $278,293 | $46,057 | $232,236 |
| 2019 | $22,952 | $270,186 | $44,716 | $225,470 |
| 2018 | $20,885 | $270,186 | $44,716 | $225,470 |
| 2017 | $20,116 | $270,186 | $44,716 | $225,470 |
| 2016 | $19,149 | $253,978 | $45,672 | $208,306 |
| 2015 | $19,339 | $253,978 | $45,672 | $208,306 |
| 2014 | $19,454 | $253,978 | $45,672 | $208,306 |
| 2013 | $19,124 | $261,836 | $47,086 | $214,750 |
Source: Public Records
Map
Nearby Homes
- 5440 Asbury Lake Dr
- 5165 N Bend Crossing
- 5491 Asbury Lake Dr
- 5320 Meadow Walk Ln
- 3505 W Fork Rd
- 4252 Runningfawn Dr
- 3899 Ridgedale Dr
- 3775 Boomer Rd
- 4491 W Fork Rd
- 5425 Philloret Dr
- 5763 Cheviot Rd
- 5436 Philloret Dr
- 5765 Cheviot Rd Unit 52D
- 4201 Boomer Rd
- 5769 Cheviot Rd
- 5725 Lauderdale Dr
- 5165 Rowan Dr
- 4575 Boomer Rd
- 5225 Ivy Rose Ln
- Magnolia Plan at Ivy Rose - Designer Collection
- 3728 W Fork Rd
- 3736 W Fork Rd
- 3748 W Fork Rd
- 3752 W Fork Rd
- 3718 W Fork Rd
- 3756 W Fork Rd
- 3764 W Fork Rd
- 3772 W Fork Rd
- 5441 Asbury Lake Dr Unit 4
- 5443 Asbury Lake Dr Unit 6
- 5443 Asbury Lake Dr Unit 5
- 5443 Asbury Lake Dr
- 5443 Asbury Lake Dr
- 5443 Asbury Lake Dr
- 5441 Asbury Lake Dr
- 5441 Asbury Lake Dr
- 5441 Asbury Lake Dr
- 5443 Asbury Lake Dr
- 5441 Asbury Lake Dr
- 5443 Asbury Lake Dr Unit 8
Your Personal Tour Guide
Ask me questions while you tour the home.