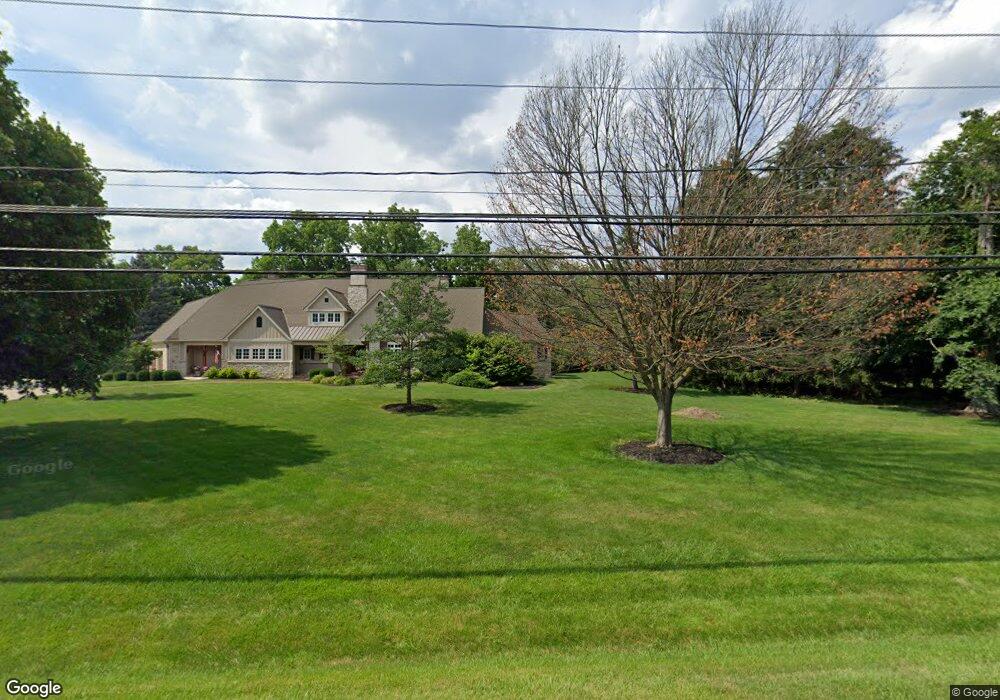
3738 Cemetery Rd Hilliard, OH 43026
Estimated Value: $902,000 - $1,576,002
5
Beds
3
Baths
4,600
Sq Ft
$252/Sq Ft
Est. Value
About This Home
This home is located at 3738 Cemetery Rd, Hilliard, OH 43026 and is currently estimated at $1,159,334, approximately $252 per square foot. 3738 Cemetery Rd is a home located in Franklin County with nearby schools including Ridgewood Elementary School, Hilliard Tharp Sixth Grade Elementary School, and Hilliard Weaver Middle School.
Ownership History
Date
Name
Owned For
Owner Type
Purchase Details
Closed on
Oct 30, 2007
Sold by
Heisler David E and Heisler Christine M
Bought by
Revoc Heisler Christine M and Revoc Christine M Heisler 2007
Current Estimated Value
Purchase Details
Closed on
Aug 20, 2004
Sold by
Lee Brian K and Lee Cheril D
Bought by
Heisler David E and Heisler Christine M
Purchase Details
Closed on
May 26, 1999
Sold by
Graff Karl F and Graff Martha S
Bought by
Lee Brian K and Lee Cheril D
Home Financials for this Owner
Home Financials are based on the most recent Mortgage that was taken out on this home.
Original Mortgage
$240,000
Outstanding Balance
$62,722
Interest Rate
6.94%
Estimated Equity
$1,096,612
Purchase Details
Closed on
Oct 7, 1993
Bought by
Graff Karl F and Graff Martha S
Purchase Details
Closed on
Sep 1, 1981
Create a Home Valuation Report for This Property
The Home Valuation Report is an in-depth analysis detailing your home's value as well as a comparison with similar homes in the area
Home Values in the Area
Average Home Value in this Area
Purchase History
| Date | Buyer | Sale Price | Title Company |
|---|---|---|---|
| Revoc Heisler Christine M | -- | Attorney | |
| Heisler David E | $475,000 | -- | |
| Lee Brian K | $346,500 | Chicago Title | |
| Graff Karl F | -- | -- | |
| -- | $100,000 | -- |
Source: Public Records
Mortgage History
| Date | Status | Borrower | Loan Amount |
|---|---|---|---|
| Open | Lee Brian K | $240,000 |
Source: Public Records
Tax History Compared to Growth
Tax History
| Year | Tax Paid | Tax Assessment Tax Assessment Total Assessment is a certain percentage of the fair market value that is determined by local assessors to be the total taxable value of land and additions on the property. | Land | Improvement |
|---|---|---|---|---|
| 2024 | $28,718 | $428,230 | $64,330 | $363,900 |
| 2023 | $23,933 | $428,225 | $64,330 | $363,895 |
| 2022 | $44,787 | $421,440 | $80,050 | $341,390 |
| 2021 | $29,746 | $421,440 | $80,050 | $341,390 |
| 2020 | $28,999 | $421,440 | $80,050 | $341,390 |
| 2019 | $28,495 | $351,190 | $66,710 | $284,480 |
| 2018 | $27,563 | $351,190 | $66,710 | $284,480 |
| 2017 | $28,390 | $351,190 | $66,710 | $284,480 |
| 2016 | $28,279 | $323,190 | $63,910 | $259,280 |
| 2015 | $26,728 | $323,190 | $63,910 | $259,280 |
| 2014 | $26,774 | $323,190 | $63,910 | $259,280 |
| 2013 | $12,945 | $307,790 | $60,865 | $246,925 |
Source: Public Records
Map
Nearby Homes
- 3320 Scioto Run Blvd
- 4025 Dublin Rd
- 3280 River Place Dr
- 3434 Fishinger Rd
- 3936 Medford Square
- 3622 Fishinger Mill Dr Unit 3622
- 3668 Ridgewood Dr
- 3438 Eastwoodlands Trail Unit 3438
- 3429 Eastwoodlands Trail Unit 3429
- 3414 Eastwoodlands Trail Unit 3414
- 3055 Carriage Ln
- 3430 Fishinger Mill Dr
- 3404 Smiley's Corner
- 4270 Llanfair Ct
- 3578 Braidwood Dr
- 3782 Falls Circle Dr Unit 25
- 3820 Falls Circle Dr
- 3216 Polley Rd
- 3660 Hilliard Station Rd Unit 3660
- 3832 Falls Circle Dr Unit 22
- 3750 Cemetery Rd
- 3726 Cemetery Rd
- 3764 Cemetery Rd
- 3737 Hilliard Cemetery Rd
- 3749 Cemetery Rd
- 3749 Hilliard Cemetery Rd
- 3776 Hilliard Cemetery Rd
- 3737 Cemetery Rd
- 3725 Cemetery Rd
- 3776 Cemetery Rd
- 3771 Cemetery Rd
- 3717 Cemetery Rd
- 3777 Cemetery Rd
- 3663 Cemetery Rd
- 3865 Lakedale Dr Unit 3865
- 3873 Lakedale Dr
- 3875 Lakedale Dr Unit 3875
- 3863 Lakedale Dr
- 3800 Hilliard Cemetery Rd
- 3867 Lakedale Dr