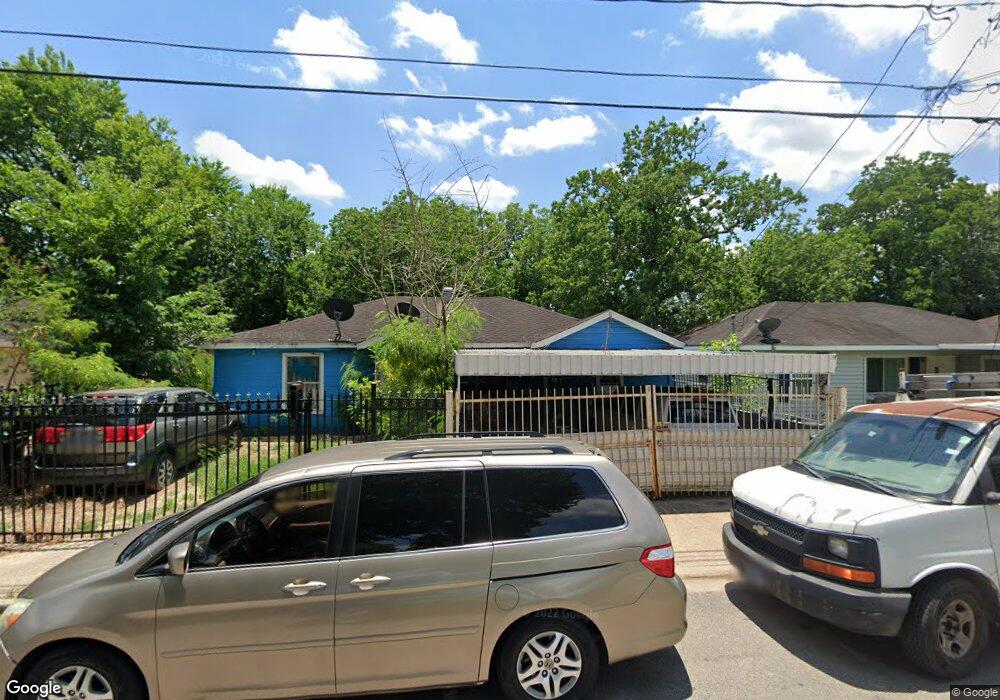
3738 Dreyfus St Houston, TX 77021
OST-South Union NeighborhoodEstimated Value: $150,000 - $170,000
3
Beds
1
Bath
1,113
Sq Ft
$142/Sq Ft
Est. Value
About This Home
This home is located at 3738 Dreyfus St, Houston, TX 77021 and is currently estimated at $158,590, approximately $142 per square foot. 3738 Dreyfus St is a home located in Harris County with nearby schools including Whidby Elementary School, Cullen Middle School, and Yates High School.
Ownership History
Date
Name
Owned For
Owner Type
Purchase Details
Closed on
Jul 12, 2011
Sold by
Mendez Jose
Bought by
Fuentes Maria and Fuentes Maria Delaluz
Current Estimated Value
Home Financials for this Owner
Home Financials are based on the most recent Mortgage that was taken out on this home.
Original Mortgage
$61,074
Outstanding Balance
$42,490
Interest Rate
4.75%
Mortgage Type
FHA
Estimated Equity
$116,100
Purchase Details
Closed on
Nov 21, 2003
Sold by
Thornton Reginald
Bought by
Mendez Jose and Fuentes Maria
Home Financials for this Owner
Home Financials are based on the most recent Mortgage that was taken out on this home.
Original Mortgage
$63,897
Interest Rate
6.06%
Mortgage Type
FHA
Purchase Details
Closed on
Dec 13, 2001
Sold by
Brownlow Tonya L
Bought by
Thonrton Reginald
Create a Home Valuation Report for This Property
The Home Valuation Report is an in-depth analysis detailing your home's value as well as a comparison with similar homes in the area
Home Values in the Area
Average Home Value in this Area
Purchase History
| Date | Buyer | Sale Price | Title Company |
|---|---|---|---|
| Fuentes Maria | -- | Chicago Title | |
| Mendez Jose | -- | Commonwealth Land Title Co | |
| Thonrton Reginald | -- | Chicago Title Insurance Co |
Source: Public Records
Mortgage History
| Date | Status | Borrower | Loan Amount |
|---|---|---|---|
| Open | Fuentes Maria | $61,074 | |
| Previous Owner | Mendez Jose | $63,897 |
Source: Public Records
Tax History Compared to Growth
Tax History
| Year | Tax Paid | Tax Assessment Tax Assessment Total Assessment is a certain percentage of the fair market value that is determined by local assessors to be the total taxable value of land and additions on the property. | Land | Improvement |
|---|---|---|---|---|
| 2025 | $974 | $138,617 | $112,500 | $26,117 |
| 2024 | $974 | $136,433 | $103,125 | $33,308 |
| 2023 | $974 | $137,536 | $98,438 | $39,098 |
| 2022 | $1,804 | $132,257 | $84,375 | $47,882 |
| 2021 | $1,736 | $94,443 | $51,563 | $42,880 |
| 2020 | $1,640 | $73,620 | $31,641 | $41,979 |
| 2019 | $1,558 | $61,558 | $24,609 | $36,949 |
| 2018 | $869 | $57,539 | $21,094 | $36,445 |
| 2017 | $1,455 | $57,539 | $21,094 | $36,445 |
| 2016 | $1,209 | $47,825 | $14,063 | $33,762 |
| 2015 | $1,229 | $47,825 | $14,063 | $33,762 |
| 2014 | $1,229 | $47,825 | $14,063 | $33,762 |
Source: Public Records
Map
Nearby Homes
- 3734 Corder St
- 7209 La Salette St
- 3722 Nathaniel Brown St
- 3824 Amos St
- 3706 Nathaniel Brown St
- 3624 Corder St
- 3730 Lehall St
- 3810 Lehall St
- 3804 Mount Pleasant St Unit 9
- 3827 Amos St
- 3634 Dreyfus St
- 3830 Mount Pleasant St
- 3638 Nathaniel Brown St
- 3617 Dreyfus St
- 3655 Seabrook St
- 3814 Seabrook St
- 3620 Corder St
- 3704 Seabrook St
- 3811 Noah St
- 3733 Noah St
- 3742 Dreyfus St
- 3734 Dreyfus St
- 3739 Corder St
- 3735 Corder St
- 3743 Corder St
- 3746 Dreyfus St
- 3730 Dreyfus St
- 3747 Corder St
- 3731 Corder St
- 3739 Dreyfus St
- 3743 Dreyfus St
- 3735 Dreyfus St
- 3726 Dreyfus St
- 3727 Corder St
- 3731 Dreyfus St
- 3747 Dreyfus St
- 3802 Dreyfus St
- 3722 Dreyfus St
- 3803 Corder St
- 3727 Dreyfus St