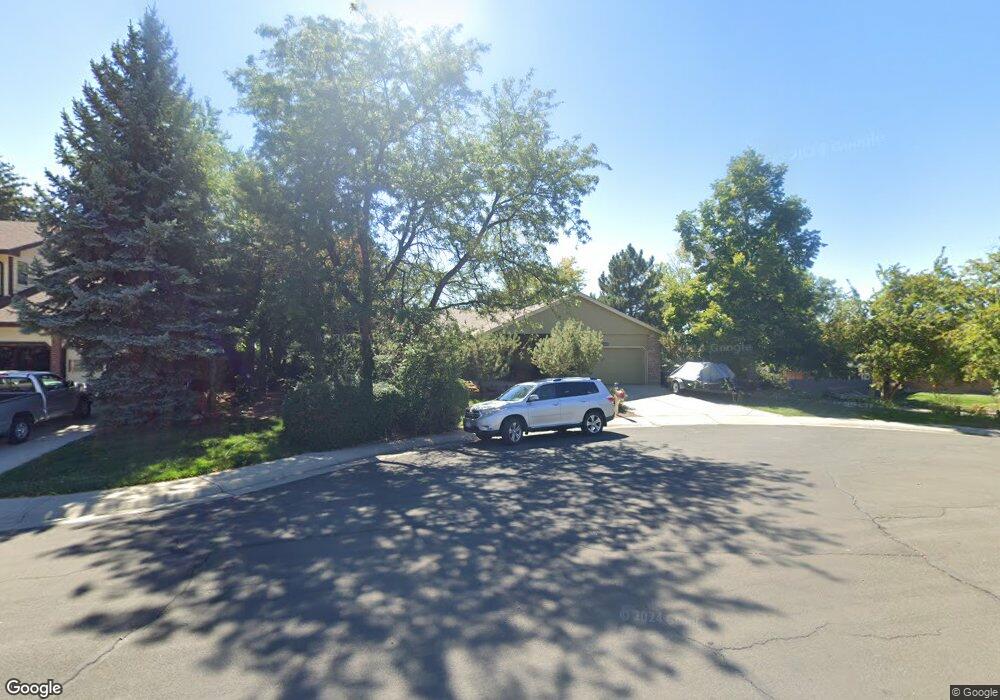
3738 E 133rd Cir Thornton, CO 80241
Estimated Value: $551,895 - $620,000
4
Beds
3
Baths
3,112
Sq Ft
$188/Sq Ft
Est. Value
About This Home
This home is located at 3738 E 133rd Cir, Thornton, CO 80241 and is currently estimated at $586,224, approximately $188 per square foot. 3738 E 133rd Cir is a home located in Adams County with nearby schools including Tarver Elementary School, Century Middle School, and Horizon High School.
Ownership History
Date
Name
Owned For
Owner Type
Purchase Details
Closed on
Oct 24, 2016
Sold by
Palko Thomas J and Palko Stephene M
Bought by
Beninati Charles A and Beninati Cinda K
Current Estimated Value
Purchase Details
Closed on
Mar 29, 1996
Sold by
Bartling Michael R and Bartling Linda
Bought by
Palko Thomas J and Palko Stephanie M
Home Financials for this Owner
Home Financials are based on the most recent Mortgage that was taken out on this home.
Original Mortgage
$139,450
Interest Rate
6.92%
Create a Home Valuation Report for This Property
The Home Valuation Report is an in-depth analysis detailing your home's value as well as a comparison with similar homes in the area
Purchase History
| Date | Buyer | Sale Price | Title Company |
|---|---|---|---|
| Beninati Charles A | $367,000 | Land Title Guarantee | |
| Palko Thomas J | $154,950 | Empire Title & Escrow |
Source: Public Records
Mortgage History
| Date | Status | Borrower | Loan Amount |
|---|---|---|---|
| Previous Owner | Palko Thomas J | $139,450 |
Source: Public Records
Tax History
| Year | Tax Paid | Tax Assessment Tax Assessment Total Assessment is a certain percentage of the fair market value that is determined by local assessors to be the total taxable value of land and additions on the property. | Land | Improvement |
|---|---|---|---|---|
| 2025 | $3,880 | $39,240 | $7,480 | $31,760 |
| 2024 | $3,880 | $36,070 | $6,880 | $29,190 |
| 2023 | $3,840 | $41,200 | $6,900 | $34,300 |
| 2022 | $3,393 | $30,800 | $7,090 | $23,710 |
| 2021 | $3,505 | $30,800 | $7,090 | $23,710 |
| 2020 | $3,279 | $29,390 | $7,290 | $22,100 |
| 2019 | $3,285 | $29,390 | $7,290 | $22,100 |
| 2018 | $2,570 | $22,330 | $7,200 | $15,130 |
| 2017 | $2,336 | $22,330 | $7,200 | $15,130 |
| 2016 | $1,986 | $18,480 | $4,140 | $14,340 |
| 2015 | $1,983 | $18,480 | $4,140 | $14,340 |
| 2014 | $1,859 | $16,840 | $3,340 | $13,500 |
Source: Public Records
Map
Nearby Homes
- 3867 E 133rd Ct
- 4087 E 133rd Cir
- 13068 Harrison Dr
- 13064 Harrison Dr
- 13055 Harrison Dr
- 13064 Garfield Dr
- 13488 Monroe St
- 13004 Harrison Dr
- 13222 Clermont Cir
- 13212 Clermont Cir
- 2973 E 133rd Ln
- 3670 E 128th Place
- 0 Colorado Blvd
- 12993 Birch Dr
- 2615 Signal Creek Dr
- 13406 Clayton St
- 13604 Garfield St Unit E
- 13608 Garfield St Unit D
- 12804 Harrison St
- 13638 Garfield St Unit C
- 3739 E 133rd Cir
- 3690 E 133rd Cir
- 3779 E 133rd Cir
- 3788 E 133rd Cir
- 3671 E 133rd Cir
- 3809 E 133rd Cir
- 3680 E 133rd Cir
- 3692 E 133rd Ct
- 3808 E 133rd Cir
- 3786 E 133rd Ct
- 3682 E 133rd Ct
- 13220 Garfield Place
- 3661 E 133rd Cir
- 3670 E 133rd Cir
- 3839 E 133rd Cir
- 3806 E 133rd Ct
- 3672 E 133rd Ct
- 13210 Garfield Place
- 3838 E 133rd Cir
- 3726 E 133rd Ct
Your Personal Tour Guide
Ask me questions while you tour the home.