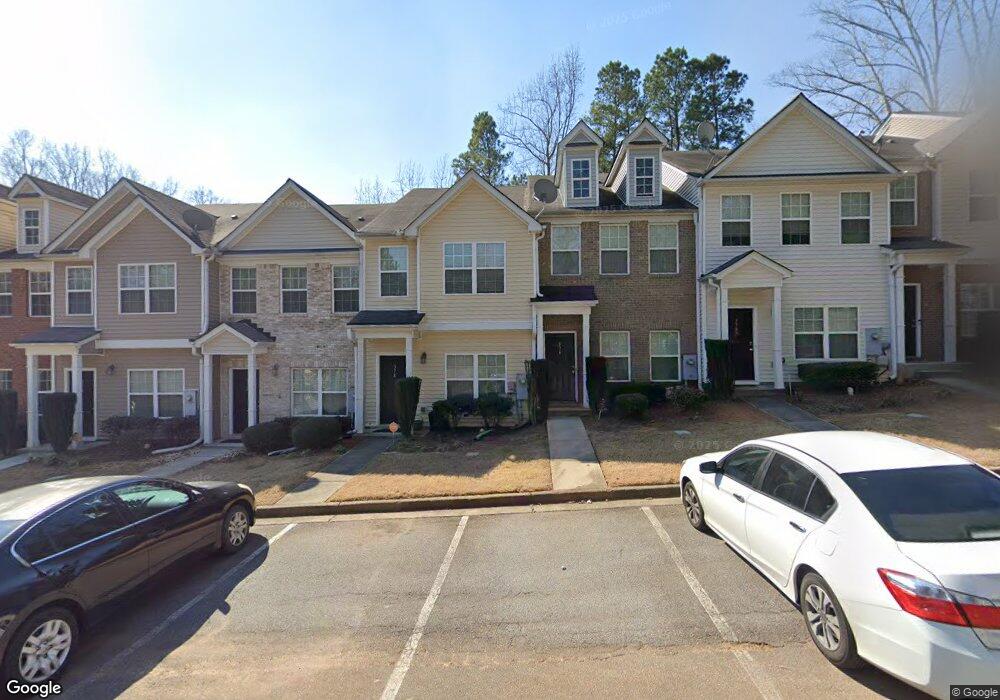
374 Berckman Dr NW Lilburn, GA 30047
Estimated Value: $241,000 - $255,000
2
Beds
3
Baths
1,418
Sq Ft
$175/Sq Ft
Est. Value
About This Home
This home is located at 374 Berckman Dr NW, Lilburn, GA 30047 and is currently estimated at $248,242, approximately $175 per square foot. 374 Berckman Dr NW is a home located in Gwinnett County with nearby schools including Lilburn Elementary School, Lilburn Middle School, and Meadowcreek High School.
Ownership History
Date
Name
Owned For
Owner Type
Purchase Details
Closed on
Dec 9, 2021
Sold by
Zillow Homes Property Trust
Bought by
Davis Patricia
Current Estimated Value
Purchase Details
Closed on
Aug 23, 2021
Sold by
Chen Song Tang
Bought by
Zillow Homes Property Trust
Purchase Details
Closed on
Jan 18, 2012
Sold by
Secretary Of Housing And U
Bought by
Chen Song Tang
Home Financials for this Owner
Home Financials are based on the most recent Mortgage that was taken out on this home.
Original Mortgage
$31,207
Interest Rate
5.25%
Mortgage Type
New Conventional
Purchase Details
Closed on
May 3, 2011
Sold by
Smith Karen M
Bought by
Suntrust Mtg Inc
Purchase Details
Closed on
Jun 30, 2008
Sold by
Battle Properties Inc
Bought by
Smith Karen M
Home Financials for this Owner
Home Financials are based on the most recent Mortgage that was taken out on this home.
Original Mortgage
$125,000
Interest Rate
6.31%
Mortgage Type
FHA
Create a Home Valuation Report for This Property
The Home Valuation Report is an in-depth analysis detailing your home's value as well as a comparison with similar homes in the area
Home Values in the Area
Average Home Value in this Area
Purchase History
| Date | Buyer | Sale Price | Title Company |
|---|---|---|---|
| Davis Patricia | $196,900 | -- | |
| Zillow Homes Property Trust | $201,790 | -- | |
| Zillow Homes Property Trust | $201,790 | -- | |
| Chen Song Tang | -- | -- | |
| Suntrust Mtg Inc | $138,120 | -- | |
| Smith Karen M | $127,000 | -- |
Source: Public Records
Mortgage History
| Date | Status | Borrower | Loan Amount |
|---|---|---|---|
| Previous Owner | Chen Song Tang | $31,207 | |
| Previous Owner | Smith Karen M | $125,000 |
Source: Public Records
Tax History Compared to Growth
Tax History
| Year | Tax Paid | Tax Assessment Tax Assessment Total Assessment is a certain percentage of the fair market value that is determined by local assessors to be the total taxable value of land and additions on the property. | Land | Improvement |
|---|---|---|---|---|
| 2024 | $527 | $101,160 | $18,000 | $83,160 |
| 2023 | $527 | $89,680 | $14,000 | $75,680 |
| 2022 | $527 | $76,120 | $11,600 | $64,520 |
| 2021 | $1,730 | $54,280 | $8,000 | $46,280 |
| 2020 | $2,052 | $54,280 | $8,000 | $46,280 |
| 2019 | $1,730 | $45,800 | $8,000 | $37,800 |
| 2018 | $1,737 | $45,800 | $8,000 | $37,800 |
| 2016 | $1,060 | $27,800 | $4,000 | $23,800 |
| 2015 | $1,072 | $27,800 | $4,000 | $23,800 |
| 2014 | -- | $27,800 | $4,000 | $23,800 |
Source: Public Records
Map
Nearby Homes
- 440 Berckman Dr NW
- 474 Berckman Dr NW
- 510 Berckman Dr NW
- 4884 Maurice Dr NW
- 75 Jon Jeff Dr NW Unit 3
- 4917 Velva Way NW
- 181 Dewey Rd Unit 70
- 736 Indian Lake Dr NW
- 790 Indian Lake Dr NW
- 4876 Velva Way NW
- 5367 Jay Way NW
- 219 Poplar St NW
- 5410 Nathan Dr NW
- 862 Brandlwood Way NW Unit 2
- 315 Greenwood Dr NW
- 147 Railroad Ave NW
- 4716 Mossy Ln NW Unit 1
- 246 Greenwood Dr NW Unit 1
- 374 Berckman Dr NW Unit 61
- 374 Berckman Dr NW Unit 374
- 372 Berckman Dr NW
- 376 Berckman Dr NW Unit 376
- 370 Berckman Dr NW Unit 370
- 370 Berckman Dr NW
- 370 Berckman Dr NW Unit 63
- 378 Berckman Dr NW
- 378 Berckman Dr NW Unit 378
- 368 Berckman Dr NW
- 380 Berckman Dr NW Unit 58
- 380 Berckman Dr NW
- 380 Berckman Dr NW Unit 380
- 382 Berckman Dr NW
- 386 Berckman Dr NW
- 388 Berckman Dr NW
- 390 Berckman Dr NW
- 392 Berckman Dr NW
- 394 Berckman Dr NW
- 384 Holly Ridge Dr NW Unit 1