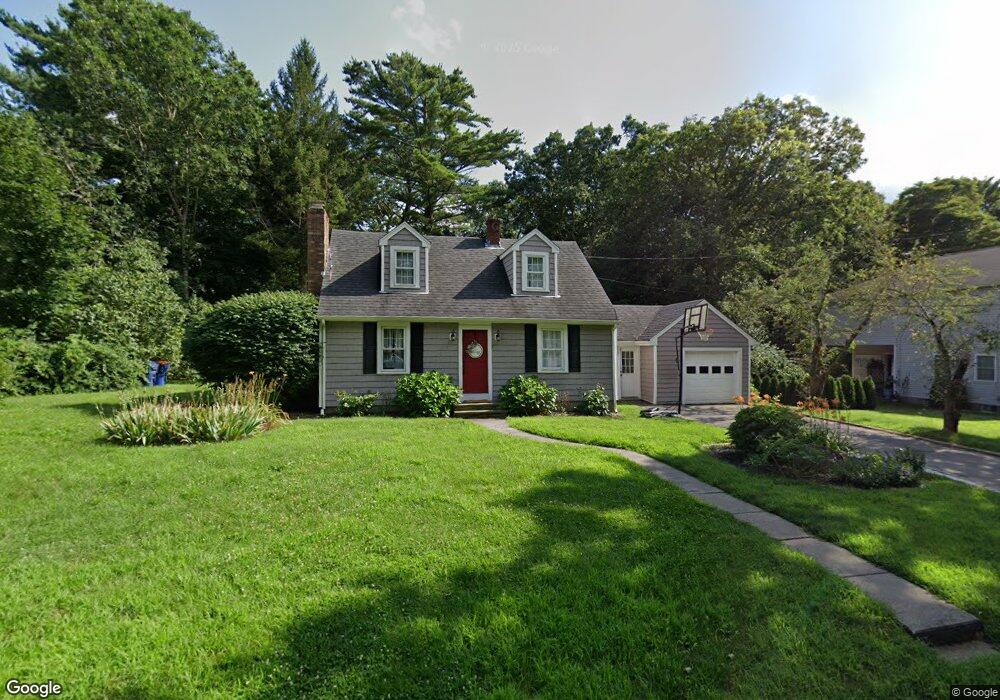
374 Briggs Rd Westport, MA 02790
North Westport NeighborhoodEstimated Value: $491,000 - $584,000
3
Beds
2
Baths
1,411
Sq Ft
$388/Sq Ft
Est. Value
About This Home
This home is located at 374 Briggs Rd, Westport, MA 02790 and is currently estimated at $546,970, approximately $387 per square foot. 374 Briggs Rd is a home located in Bristol County with nearby schools including Alice A. Macomber Primary School, Westport Elementary School, and Westport Middle-High School.
Ownership History
Date
Name
Owned For
Owner Type
Purchase Details
Closed on
Jul 14, 2006
Sold by
Anderson Jill A and Anderson Mark H
Bought by
Grieve Jesse L and Grieve Matthew D
Current Estimated Value
Purchase Details
Closed on
Apr 20, 2004
Sold by
Bishop David and Bishop Susan B
Bought by
Anderson Jill A and Anderson Mark H
Purchase Details
Closed on
May 27, 1993
Sold by
Sunderland Jeffrey D and Sunderland Carol F
Bought by
Bishop David and Bishop Susan B
Create a Home Valuation Report for This Property
The Home Valuation Report is an in-depth analysis detailing your home's value as well as a comparison with similar homes in the area
Home Values in the Area
Average Home Value in this Area
Purchase History
| Date | Buyer | Sale Price | Title Company |
|---|---|---|---|
| Grieve Jesse L | $335,000 | -- | |
| Anderson Jill A | $286,000 | -- | |
| Bishop David | $139,000 | -- |
Source: Public Records
Mortgage History
| Date | Status | Borrower | Loan Amount |
|---|---|---|---|
| Open | Bishop David | $2,654,000 | |
| Closed | Bishop David | $20,000 |
Source: Public Records
Tax History Compared to Growth
Tax History
| Year | Tax Paid | Tax Assessment Tax Assessment Total Assessment is a certain percentage of the fair market value that is determined by local assessors to be the total taxable value of land and additions on the property. | Land | Improvement |
|---|---|---|---|---|
| 2025 | $3,363 | $451,400 | $184,500 | $266,900 |
| 2024 | $2,829 | $366,000 | $171,000 | $195,000 |
| 2023 | $2,694 | $330,200 | $149,800 | $180,400 |
| 2022 | $2,570 | $303,100 | $149,800 | $153,300 |
| 2021 | $2,495 | $289,500 | $136,200 | $153,300 |
| 2020 | $2,394 | $284,000 | $130,700 | $153,300 |
| 2019 | $1,856 | $256,300 | $113,700 | $142,600 |
| 2018 | $2,745 | $247,500 | $121,200 | $126,300 |
| 2017 | $1,989 | $249,500 | $121,200 | $128,300 |
| 2016 | $1,886 | $238,400 | $121,200 | $117,200 |
| 2015 | $1,855 | $233,900 | $121,200 | $112,700 |
Source: Public Records
Map
Nearby Homes