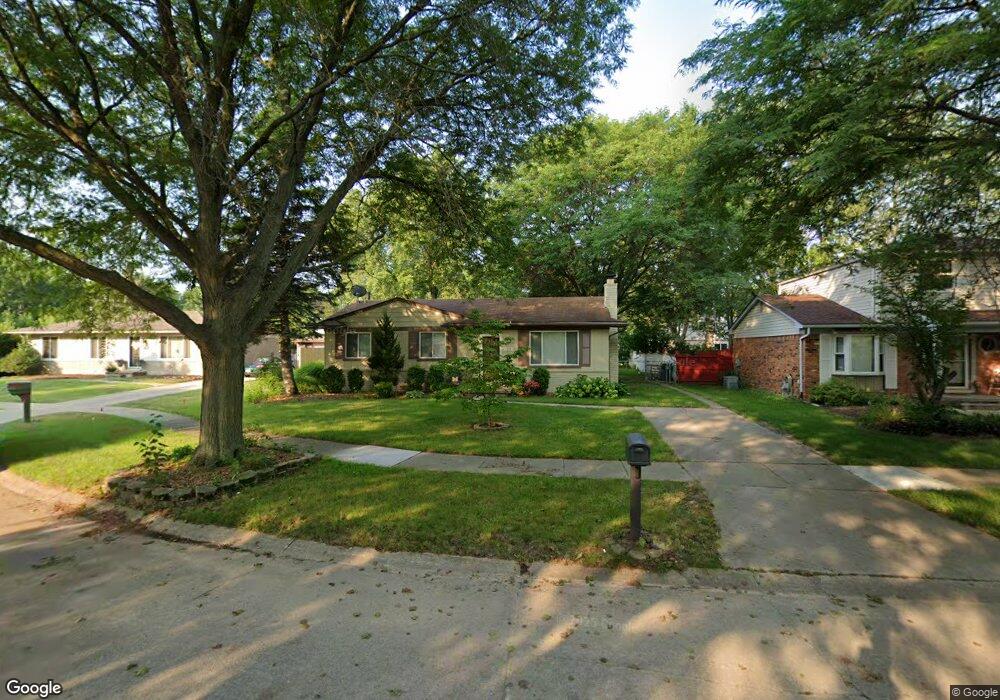
374 Charterhouse Ct Unit Bldg-Unit Canton, MI 48188
Estimated Value: $283,000 - $306,000
--
Bed
1
Bath
1,025
Sq Ft
$291/Sq Ft
Est. Value
About This Home
This home is located at 374 Charterhouse Ct Unit Bldg-Unit, Canton, MI 48188 and is currently estimated at $297,924, approximately $290 per square foot. 374 Charterhouse Ct Unit Bldg-Unit is a home located in Wayne County with nearby schools including Canton High School, Discovery Middle School, and Salem High School.
Ownership History
Date
Name
Owned For
Owner Type
Purchase Details
Closed on
May 14, 2019
Sold by
Mccowan Michael and Dickinson Stephen
Bought by
374 Charterhouse Llc
Current Estimated Value
Home Financials for this Owner
Home Financials are based on the most recent Mortgage that was taken out on this home.
Original Mortgage
$250,000
Outstanding Balance
$219,801
Interest Rate
4.2%
Mortgage Type
Commercial
Estimated Equity
$78,123
Purchase Details
Closed on
Apr 17, 2012
Sold by
Secretary Of Housing & Urban Development
Bought by
Mccowan Michael and Dickinson Stephen
Home Financials for this Owner
Home Financials are based on the most recent Mortgage that was taken out on this home.
Original Mortgage
$43,947
Interest Rate
3.91%
Mortgage Type
New Conventional
Purchase Details
Closed on
Aug 10, 2011
Sold by
Flagstar Bank Fsb
Bought by
The Secretary Of Housing & Urban Develop
Purchase Details
Closed on
Feb 2, 2011
Sold by
Seilheimer Michael E
Bought by
Flagstar Bank Fsb
Purchase Details
Closed on
Jun 24, 2005
Sold by
Brabant Terry A and Brabant William T
Bought by
Seilheimer Michael E
Create a Home Valuation Report for This Property
The Home Valuation Report is an in-depth analysis detailing your home's value as well as a comparison with similar homes in the area
Home Values in the Area
Average Home Value in this Area
Purchase History
| Date | Buyer | Sale Price | Title Company |
|---|---|---|---|
| 374 Charterhouse Llc | -- | None Available | |
| Mccowan Michael | $58,596 | None Available | |
| The Secretary Of Housing & Urban Develop | -- | None Available | |
| Flagstar Bank Fsb | $146,861 | None Available | |
| Seilheimer Michael E | $172,500 | Multiple |
Source: Public Records
Mortgage History
| Date | Status | Borrower | Loan Amount |
|---|---|---|---|
| Open | 374 Charterhouse Llc | $250,000 | |
| Previous Owner | Mccowan Michael | $43,947 |
Source: Public Records
Tax History Compared to Growth
Tax History
| Year | Tax Paid | Tax Assessment Tax Assessment Total Assessment is a certain percentage of the fair market value that is determined by local assessors to be the total taxable value of land and additions on the property. | Land | Improvement |
|---|---|---|---|---|
| 2025 | $2,390 | $122,600 | $0 | $0 |
| 2024 | $2,390 | $112,200 | $0 | $0 |
| 2023 | $2,278 | $100,400 | $0 | $0 |
| 2022 | $3,714 | $92,800 | $0 | $0 |
| 2021 | $3,607 | $91,100 | $0 | $0 |
| 2020 | $3,562 | $85,800 | $0 | $0 |
| 2019 | $3,366 | $76,710 | $0 | $0 |
| 2018 | $1,875 | $73,860 | $0 | $0 |
| 2017 | $2,431 | $77,700 | $0 | $0 |
| 2016 | $3,035 | $76,900 | $0 | $0 |
| 2015 | $5,069 | $67,710 | $0 | $0 |
| 2013 | $4,911 | $51,010 | $0 | $0 |
| 2010 | -- | $55,290 | $33,530 | $21,760 |
Source: Public Records
Map
Nearby Homes
- 632 Georgetown St
- 39615 Kirkland Dr
- 39400 Cherry Hill Rd
- 0 Cherry Hill Unit 16924
- 151 Dawson Ct
- 170 Cherry Hill Pointe Dr
- 285 Brookfield Dr Unit 25
- 39214 Dillingham St
- 39605 Dorchester Cir
- 157 Carson Dr Unit 175
- 870 N Lotz Rd
- 127 S John Hix St
- 39635 Lotzford Rd
- 39194 Brookfield Dr Unit 182
- 571 Summerfield Dr Unit 196
- 39250 Northampton St
- 41109 Southwind Dr
- 41140 Northwind Dr
- 714 Autumn Ridge Dr Unit 64
- 673 Ethan Dr
- 374 Charterhouse Ct
- 366 Charterhouse Ct
- 386 Charterhouse Ct
- 354 Charterhouse Ct
- 625 Merrimac Rd
- 637 Merrimac Rd
- 613 Merrimac Rd
- 394 Charterhouse Ct
- 649 Merrimac Rd
- 601 Merrimac Rd
- 346 Charterhouse Ct
- 367 Charterhouse Ct
- 375 Charterhouse Ct
- 355 Charterhouse Ct
- 467 Merrimac Rd
- 385 Charterhouse Ct
- 397 Charterhouse Ct
- 345 Charterhouse Ct
- 334 Charterhouse Ct
- 673 Merrimac Rd