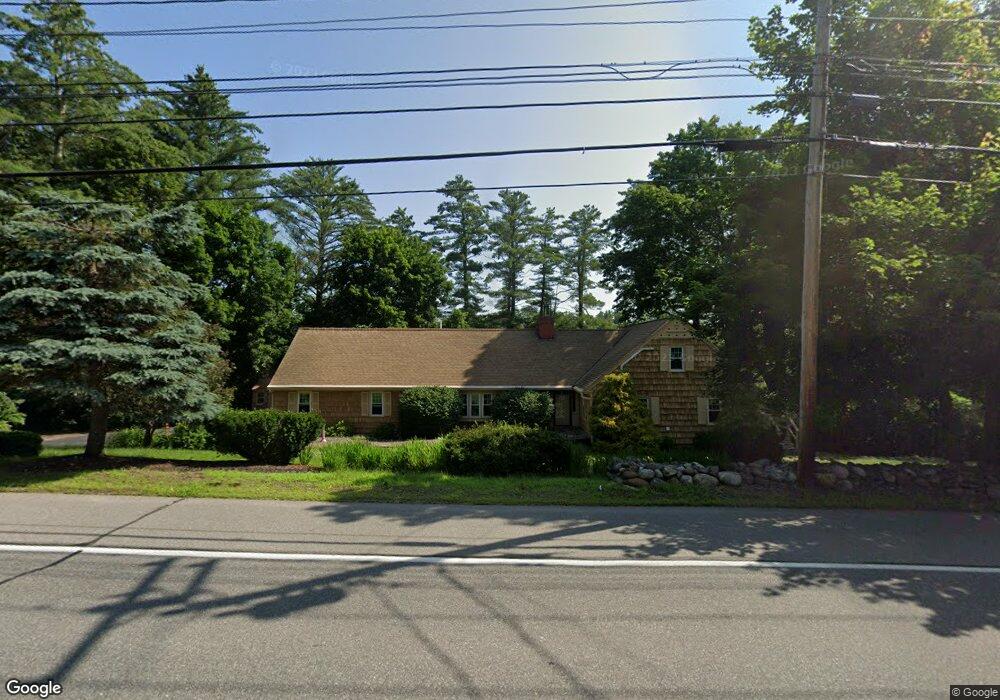
374 Main St Springvale, ME 04083
Estimated Value: $348,000 - $620,019
4
Beds
4
Baths
2,822
Sq Ft
$187/Sq Ft
Est. Value
About This Home
This home is located at 374 Main St, Springvale, ME 04083 and is currently estimated at $529,005, approximately $187 per square foot. 374 Main St is a home located in York County with nearby schools including St Thomas Consolidated School and Sanford Christian Academy.
Ownership History
Date
Name
Owned For
Owner Type
Purchase Details
Closed on
Oct 21, 2013
Sold by
Drummey Thomas M
Bought by
Young Jeffrey T and Young Cheryl M
Current Estimated Value
Home Financials for this Owner
Home Financials are based on the most recent Mortgage that was taken out on this home.
Original Mortgage
$260,000
Outstanding Balance
$194,810
Interest Rate
4.58%
Mortgage Type
New Conventional
Estimated Equity
$334,195
Purchase Details
Closed on
May 12, 2010
Sold by
Craft Mark H and Craft Irene L
Bought by
Drummey Thomas M
Create a Home Valuation Report for This Property
The Home Valuation Report is an in-depth analysis detailing your home's value as well as a comparison with similar homes in the area
Home Values in the Area
Average Home Value in this Area
Purchase History
| Date | Buyer | Sale Price | Title Company |
|---|---|---|---|
| Young Jeffrey T | -- | -- | |
| Drummey Thomas M | -- | -- |
Source: Public Records
Mortgage History
| Date | Status | Borrower | Loan Amount |
|---|---|---|---|
| Open | Young Jeffrey T | $260,000 | |
| Previous Owner | Drummey Thomas M | $26,000 | |
| Previous Owner | Drummey Thomas M | $256,000 |
Source: Public Records
Tax History
| Year | Tax Paid | Tax Assessment Tax Assessment Total Assessment is a certain percentage of the fair market value that is determined by local assessors to be the total taxable value of land and additions on the property. | Land | Improvement |
|---|---|---|---|---|
| 2025 | $8,842 | $517,100 | $60,600 | $456,500 |
| 2024 | $8,346 | $517,100 | $60,600 | $456,500 |
| 2023 | $7,765 | $512,900 | $60,600 | $452,300 |
| 2022 | $7,591 | $512,900 | $60,600 | $452,300 |
| 2021 | $7,527 | $414,000 | $60,600 | $353,400 |
| 2020 | $7,161 | $355,200 | $60,600 | $294,600 |
| 2019 | $6,856 | $331,200 | $60,600 | $270,600 |
| 2018 | $6,601 | $322,000 | $60,600 | $261,400 |
| 2017 | $6,346 | $306,000 | $60,600 | $245,400 |
| 2016 | $6,508 | $286,200 | $60,600 | $225,600 |
| 2015 | $6,698 | $303,900 | $72,800 | $231,100 |
| 2014 | $6,627 | $306,500 | $75,400 | $231,100 |
| 2013 | -- | $306,500 | $75,400 | $231,100 |
Source: Public Records
Map
Nearby Homes
Your Personal Tour Guide
Ask me questions while you tour the home.