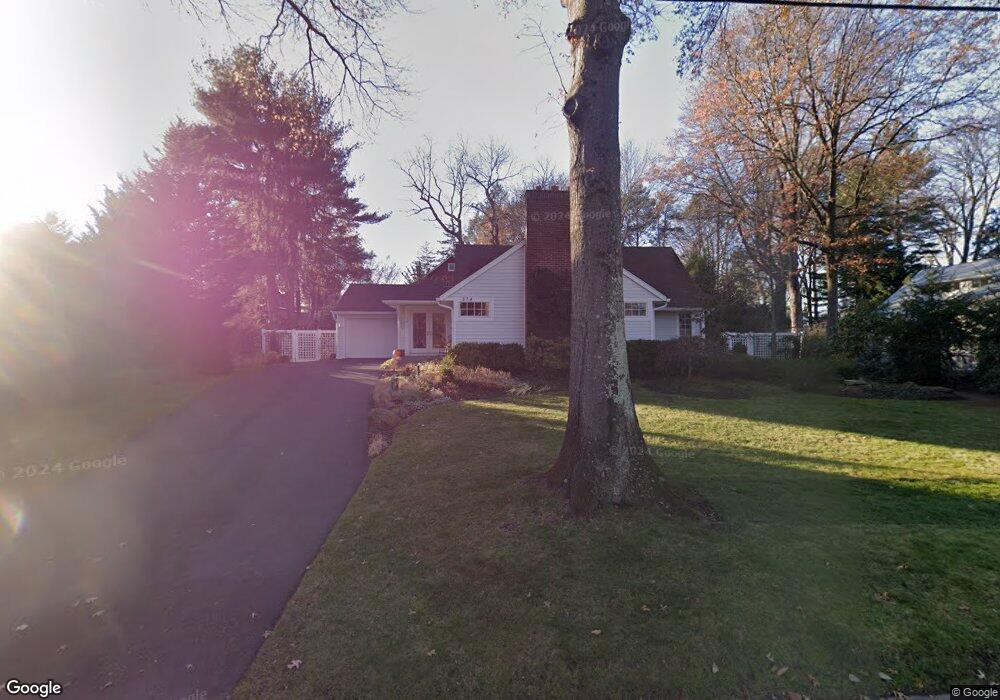
374 Pine Ln Haworth, NJ 07641
Estimated Value: $1,035,125 - $1,367,000
Studio
--
Bath
2,387
Sq Ft
$490/Sq Ft
Est. Value
About This Home
This home is located at 374 Pine Ln, Haworth, NJ 07641 and is currently estimated at $1,170,531, approximately $490 per square foot. 374 Pine Ln is a home located in Bergen County with nearby schools including Haworth Elementary School, Northern Valley Regional High School at Demarest, and Acton Academy of Bergen County.
Ownership History
Date
Name
Owned For
Owner Type
Purchase Details
Closed on
Nov 27, 2013
Sold by
Smith Thomas Fayette
Bought by
Goldstein Frances
Current Estimated Value
Home Financials for this Owner
Home Financials are based on the most recent Mortgage that was taken out on this home.
Original Mortgage
$415,000
Outstanding Balance
$311,889
Interest Rate
4.35%
Mortgage Type
New Conventional
Estimated Equity
$858,642
Create a Home Valuation Report for This Property
The Home Valuation Report is an in-depth analysis detailing your home's value as well as a comparison with similar homes in the area
Home Values in the Area
Average Home Value in this Area
Purchase History
| Date | Buyer | Sale Price | Title Company |
|---|---|---|---|
| Goldstein Frances | $520,000 | -- |
Source: Public Records
Mortgage History
| Date | Status | Borrower | Loan Amount |
|---|---|---|---|
| Open | Goldstein Frances | $415,000 |
Source: Public Records
Tax History Compared to Growth
Tax History
| Year | Tax Paid | Tax Assessment Tax Assessment Total Assessment is a certain percentage of the fair market value that is determined by local assessors to be the total taxable value of land and additions on the property. | Land | Improvement |
|---|---|---|---|---|
| 2025 | $17,525 | $566,800 | $247,500 | $319,300 |
| 2024 | $17,242 | $566,800 | $247,500 | $319,300 |
| 2023 | $16,885 | $566,800 | $247,500 | $319,300 |
| 2022 | $16,885 | $566,800 | $247,500 | $319,300 |
| 2021 | $16,687 | $566,800 | $247,500 | $319,300 |
| 2020 | $16,545 | $566,800 | $247,500 | $319,300 |
| 2019 | $16,500 | $566,800 | $247,500 | $319,300 |
| 2018 | $16,250 | $566,800 | $247,500 | $319,300 |
| 2017 | $16,341 | $566,800 | $247,500 | $319,300 |
| 2016 | $15,484 | $532,100 | $247,500 | $284,600 |
| 2015 | $14,872 | $532,100 | $247,500 | $284,600 |
| 2014 | $14,393 | $468,300 | $247,500 | $220,800 |
Source: Public Records
Map
Nearby Homes
- 115 Morris Ave
- 65 Prospect Ave
- 308 Spring Ln
- 110 Mason Ct Unit 3H
- 214 Durie Ave
- 199 Whitman St
- 226 Haworth Ave
- 280 Knickerbocker Rd
- 277 Maple St
- 124 Valley Rd
- 106 Prescott St
- 31 Madison Ave
- 390 Harland Ave
- 51 Julia St
- 6 Cedar Ct
- 34 Summit Place
- 64 Harwich Rd
- 283 Harrington Ave
- 13 Poplar St
- 120 Larch Ave