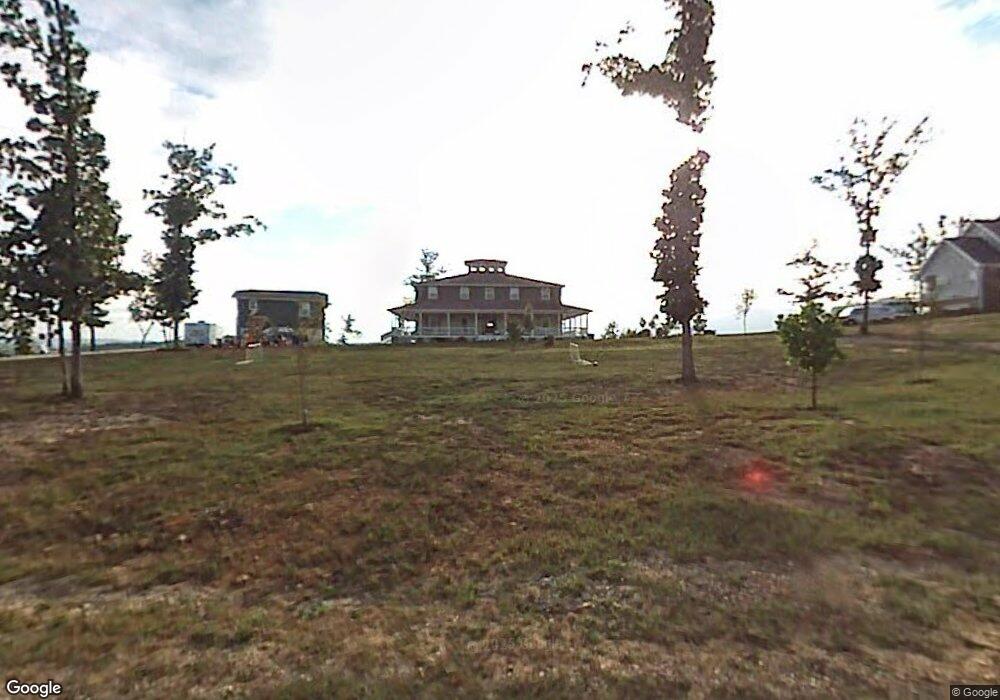
374 S Deer Run Rd Trenton, GA 30752
Estimated Value: $588,000 - $823,984
5
Beds
5
Baths
5,029
Sq Ft
$133/Sq Ft
Est. Value
About This Home
This home is located at 374 S Deer Run Rd, Trenton, GA 30752 and is currently estimated at $667,996, approximately $132 per square foot. 374 S Deer Run Rd is a home located in Dade County with nearby schools including Dade Middle School and Dade County High School.
Ownership History
Date
Name
Owned For
Owner Type
Purchase Details
Closed on
Sep 13, 2016
Sold by
William M
Bought by
Mitchell Ian and Mitchell Melissa
Current Estimated Value
Home Financials for this Owner
Home Financials are based on the most recent Mortgage that was taken out on this home.
Original Mortgage
$268,000
Outstanding Balance
$214,068
Interest Rate
3.43%
Mortgage Type
New Conventional
Estimated Equity
$453,928
Purchase Details
Closed on
Nov 3, 2010
Sold by
Poteet Paul D
Bought by
Rosenbalm Paul D and Rosenbalm William Everett
Home Financials for this Owner
Home Financials are based on the most recent Mortgage that was taken out on this home.
Original Mortgage
$235,000
Interest Rate
4.33%
Mortgage Type
New Conventional
Purchase Details
Closed on
Dec 20, 2001
Sold by
Poteet Paul D
Bought by
Poteet Paul D and Poteet Will
Create a Home Valuation Report for This Property
The Home Valuation Report is an in-depth analysis detailing your home's value as well as a comparison with similar homes in the area
Home Values in the Area
Average Home Value in this Area
Purchase History
| Date | Buyer | Sale Price | Title Company |
|---|---|---|---|
| Mitchell Ian | -- | -- | |
| Mitchell Ian | $335,000 | -- | |
| Rosenbalm Paul D | -- | -- | |
| Poteet Paul D | -- | -- | |
| Poteet Paul D | $25,500 | -- |
Source: Public Records
Mortgage History
| Date | Status | Borrower | Loan Amount |
|---|---|---|---|
| Open | Mitchell Ian | $268,000 | |
| Closed | Mitchell Ian | $268,000 | |
| Previous Owner | Rosenbalm Paul D | $235,000 |
Source: Public Records
Tax History Compared to Growth
Tax History
| Year | Tax Paid | Tax Assessment Tax Assessment Total Assessment is a certain percentage of the fair market value that is determined by local assessors to be the total taxable value of land and additions on the property. | Land | Improvement |
|---|---|---|---|---|
| 2024 | $5,295 | $240,696 | $20,160 | $220,536 |
| 2023 | $5,389 | $240,696 | $20,160 | $220,536 |
| 2022 | $4,462 | $200,976 | $8,800 | $192,176 |
| 2021 | $3,177 | $143,920 | $8,800 | $135,120 |
| 2020 | $2,843 | $123,840 | $8,800 | $115,040 |
| 2019 | $2,943 | $126,920 | $8,800 | $118,120 |
| 2018 | $3,045 | $126,920 | $8,800 | $118,120 |
| 2017 | $3,826 | $159,480 | $13,240 | $146,240 |
| 2016 | $3,695 | $156,840 | $13,240 | $143,600 |
| 2015 | $3,560 | $154,400 | $13,240 | $141,160 |
| 2014 | -- | $148,080 | $11,960 | $136,120 |
| 2013 | -- | $154,560 | $11,960 | $142,600 |
Source: Public Records
Map
Nearby Homes
- 984 Murphy Hollow Rd
- 1255 New Home Rd
- 648 Scratch Ankle Rd
- 37 Scratch Ankle Rd
- 71 Ballard Rd
- 41 Ballard Rd
- 616 Stallings Rd
- 3527 New Home Rd
- 316 Old Hales Gap Rd
- 3663 New Home Rd
- Lot 13 Windstone Dr
- Lot 10 Windstone Dr
- Lot 05 Windstone Dr
- 0 Slygo Rd Unit 10409260
- 0 Slygo Rd Unit 7479663
- 0 Slygo Rd Unit RTC2612526
- 0 Slygo Rd Unit 1385567
- 0 Veterans Rd Unit 15134719
- 235 Awanita Dr
- 0 Salolee Ln W Unit 1387413
- 374 S Deer Run Rd
- 328 S Deer Run Rd
- 397 S Deer Run Rd
- 292 S Deer Run Rd
- 292 S Deer Run
- 292 Deer Run Rd S
- 250 S Deer Run Rd
- 40 N Deer Run
- 40 Deer Run Rd
- 40 N Deer Run Rd
- 227 S Deer Run Rd
- 0 Deer Run Rd S Unit 1378528
- 0 Deer Run Rd S Unit RTC2562127
- 107 S Deer Run
- 45 Deer Run Rd
- 107 S Deer Run Rd
- 45 N Deer Run
- 196 S Deer Run Rd
- 196 S Deer Run Rd
- 158 S Deer Run