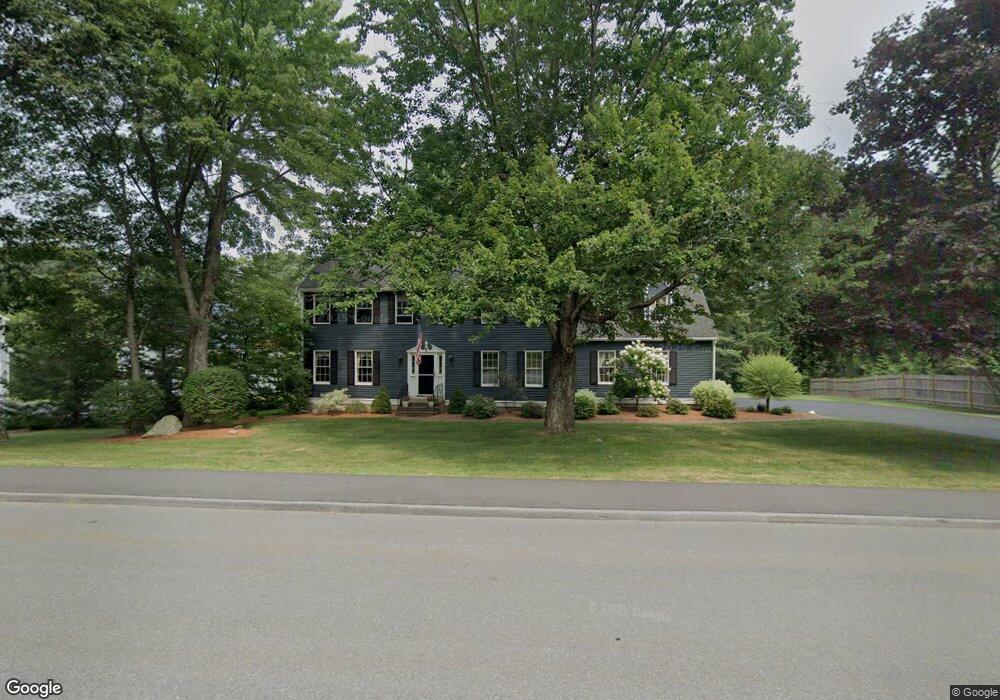
374 Simpson Rd Marlborough, MA 01752
Estimated Value: $867,000 - $953,000
4
Beds
4
Baths
3,257
Sq Ft
$280/Sq Ft
Est. Value
About This Home
This home is located at 374 Simpson Rd, Marlborough, MA 01752 and is currently estimated at $911,729, approximately $279 per square foot. 374 Simpson Rd is a home located in Middlesex County with nearby schools including Marlborough High School, New Covenant Christian School, and Glenhaven Academy - JRI School.
Ownership History
Date
Name
Owned For
Owner Type
Purchase Details
Closed on
Oct 29, 2007
Sold by
Fitzgerald James J
Bought by
Dicenzo Bonnie Lynn and Dicenzo Michael A
Current Estimated Value
Home Financials for this Owner
Home Financials are based on the most recent Mortgage that was taken out on this home.
Original Mortgage
$306,000
Interest Rate
6.39%
Mortgage Type
Purchase Money Mortgage
Purchase Details
Closed on
May 31, 1994
Sold by
Bimschleger Curt M and Bimschleger Martha E
Bought by
Frank Bruce L and Frank Catharine A
Create a Home Valuation Report for This Property
The Home Valuation Report is an in-depth analysis detailing your home's value as well as a comparison with similar homes in the area
Home Values in the Area
Average Home Value in this Area
Purchase History
| Date | Buyer | Sale Price | Title Company |
|---|---|---|---|
| Dicenzo Bonnie Lynn | $440,000 | -- | |
| Frank Bruce L | $291,000 | -- | |
| Dicenzo Bonnie Lynn | $440,000 | -- | |
| Frank Bruce L | $291,000 | -- |
Source: Public Records
Mortgage History
| Date | Status | Borrower | Loan Amount |
|---|---|---|---|
| Open | Frank Bruce L | $310,000 | |
| Closed | Frank Bruce L | $50,000 | |
| Closed | Dicenzo Bonnie Lynn | $306,000 |
Source: Public Records
Tax History
| Year | Tax Paid | Tax Assessment Tax Assessment Total Assessment is a certain percentage of the fair market value that is determined by local assessors to be the total taxable value of land and additions on the property. | Land | Improvement |
|---|---|---|---|---|
| 2025 | $8,042 | $815,600 | $230,900 | $584,700 |
| 2024 | $7,925 | $773,900 | $209,900 | $564,000 |
| 2023 | $7,971 | $690,700 | $181,400 | $509,300 |
| 2022 | $7,657 | $583,600 | $172,700 | $410,900 |
| 2021 | $7,625 | $552,500 | $144,000 | $408,500 |
| 2020 | $9,398 | $527,800 | $137,100 | $390,700 |
| 2019 | $7,222 | $513,300 | $134,400 | $378,900 |
| 2018 | $17,835 | $492,800 | $117,600 | $375,200 |
| 2017 | $7,415 | $484,000 | $117,000 | $367,000 |
| 2016 | $7,343 | $478,700 | $117,000 | $361,700 |
| 2015 | $7,280 | $461,900 | $120,000 | $341,900 |
Source: Public Records
Map
Nearby Homes
- 84 Crosby Rd
- 38 Airport Blvd
- 168 Blanchette Dr
- 68 Upland Rd
- 9 & 9A Abigail
- 92 Porter Rd
- 20 Beauregard Cir
- 0 Stevens St
- 110 Boston Post Rd E Unit 104
- 48 Cook Ln
- 181 Boston Post Rd E Unit 26
- 181 Boston Post Rd E Unit 64
- 688 Boston Post Rd E Unit 202
- 688 Boston Post Rd E Unit 100
- 688 Boston Post Rd E Unit 304
- 688 Boston Post Rd E Unit 103
- 596 Boston Post Rd E Unit 13
- 24 Wilson St Unit 4
- 18 Seneca Dr
- 70 Victoria Ln
Your Personal Tour Guide
Ask me questions while you tour the home.