Estimated Value: $453,000 - $476,386
5
Beds
3
Baths
2,340
Sq Ft
$199/Sq Ft
Est. Value
About This Home
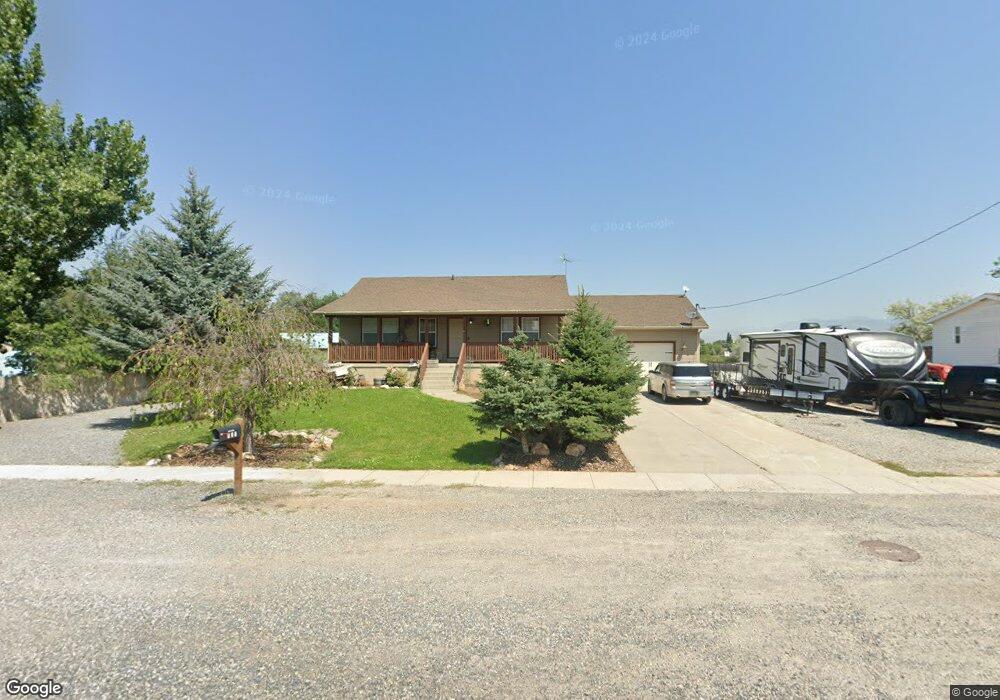
This home is located at 374 W 100 S, Hyrum, UT 84319 and is currently estimated at $464,847, approximately $198 per square foot. 374 W 100 S is a home located in Cache County with nearby schools including Lincoln School, South Cache Middle School, and Mountain Crest High School.
Ownership History
Date
Name
Owned For
Owner Type
Purchase Details
Closed on
May 9, 2022
Sold by
Jesus Garza
Bought by
Garza Jesus and Garza Tosha R
Current Estimated Value
Home Financials for this Owner
Home Financials are based on the most recent Mortgage that was taken out on this home.
Original Mortgage
$326,300
Outstanding Balance
$309,589
Interest Rate
5.27%
Mortgage Type
New Conventional
Estimated Equity
$155,258
Purchase Details
Closed on
Jun 13, 2012
Sold by
Banham Ed and Banham Wanda
Bought by
Garza Jesus
Home Financials for this Owner
Home Financials are based on the most recent Mortgage that was taken out on this home.
Original Mortgage
$183,673
Interest Rate
3.79%
Mortgage Type
New Conventional
Purchase Details
Closed on
Mar 19, 2007
Sold by
Nielsen John C and Nielsen Teresa M
Bought by
Banham Ed and Banham Wanda
Create a Home Valuation Report for This Property
The Home Valuation Report is an in-depth analysis detailing your home's value as well as a comparison with similar homes in the area
Home Values in the Area
Average Home Value in this Area
Purchase History
| Date | Buyer | Sale Price | Title Company |
|---|---|---|---|
| Garza Jesus | -- | Pinnacle Title | |
| Garza Jesus | -- | Hickman Land Title Company | |
| Banham Ed | -- | Hickman Land Title Company |
Source: Public Records
Mortgage History
| Date | Status | Borrower | Loan Amount |
|---|---|---|---|
| Open | Garza Jesus | $326,300 | |
| Previous Owner | Garza Jesus | $183,673 |
Source: Public Records
Tax History Compared to Growth
Tax History
| Year | Tax Paid | Tax Assessment Tax Assessment Total Assessment is a certain percentage of the fair market value that is determined by local assessors to be the total taxable value of land and additions on the property. | Land | Improvement |
|---|---|---|---|---|
| 2025 | $1,782 | $255,855 | $0 | $0 |
| 2024 | $1,911 | $256,230 | $0 | $0 |
| 2023 | $1,854 | $237,740 | $0 | $0 |
| 2022 | $194 | $237,740 | $0 | $0 |
| 2021 | $1,556 | $294,552 | $65,050 | $229,502 |
| 2020 | $1,490 | $264,617 | $65,050 | $199,567 |
| 2019 | $1,434 | $239,567 | $40,000 | $199,567 |
| 2018 | $1,351 | $218,185 | $40,000 | $178,185 |
| 2017 | $1,376 | $115,335 | $0 | $0 |
| 2016 | $1,407 | $86,840 | $0 | $0 |
| 2015 | $1,062 | $86,840 | $0 | $0 |
| 2014 | $1,039 | $86,840 | $0 | $0 |
| 2013 | -- | $86,840 | $0 | $0 |
Source: Public Records
Map
Nearby Homes