Estimated Value: $359,000 - $449,000
Studio
--
Bath
1,665
Sq Ft
$248/Sq Ft
Est. Value
About This Home
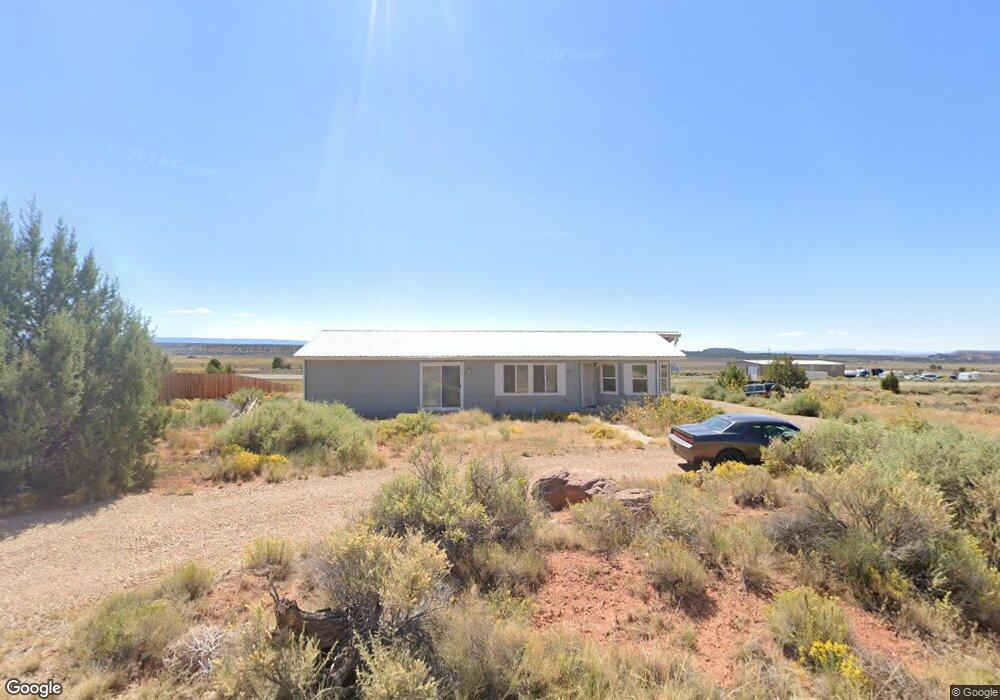
This home is located at 3740 E Juniper Cliffs Dr, Kanab, UT 84741 and is currently estimated at $412,228, approximately $247 per square foot. 3740 E Juniper Cliffs Dr is a home located in Kane County with nearby schools including Kanab Elementary School, Kanab Middle School, and Kanab High School.
Ownership History
Date
Name
Owned For
Owner Type
Purchase Details
Closed on
Apr 28, 2022
Sold by
Benson Teresa Carol
Bought by
Potter Trevor
Current Estimated Value
Purchase Details
Closed on
Apr 28, 2020
Sold by
White Kimberly S
Bought by
Benson Teresa Carol
Purchase Details
Closed on
Apr 9, 2012
Sold by
Itow Ruthie
Bought by
White Kimberly S
Home Financials for this Owner
Home Financials are based on the most recent Mortgage that was taken out on this home.
Original Mortgage
$92,000
Interest Rate
3.91%
Purchase Details
Closed on
Oct 14, 2011
Sold by
Itow Ruthie
Bought by
Itow Ruthie
Purchase Details
Closed on
May 10, 2010
Sold by
Hartmann Margaret and Hartmann Margarete R
Bought by
Hartmann Margarete R and Margarete R Harmann Living Trust 5/6/201
Purchase Details
Closed on
Feb 12, 2007
Sold by
Harmann Margaret
Bought by
Kane County
Purchase Details
Closed on
Mar 28, 2006
Sold by
Blake Kimberly
Bought by
Hartmann Margaret
Purchase Details
Closed on
Aug 22, 2005
Sold by
Cornelius Larry E
Bought by
Blake Kimberly
Create a Home Valuation Report for This Property
The Home Valuation Report is an in-depth analysis detailing your home's value as well as a comparison with similar homes in the area
Purchase History
| Date | Buyer | Sale Price | Title Company |
|---|---|---|---|
| Potter Trevor | -- | -- | |
| Benson Teresa Carol | -- | -- | |
| White Kimberly S | -- | -- | |
| Itow Ruthie | -- | -- | |
| Hartmann Margarete R | -- | -- | |
| Kane County | -- | -- | |
| Hartmann Margaret | -- | -- | |
| Blake Kimberly | -- | -- |
Source: Public Records
Mortgage History
| Date | Status | Borrower | Loan Amount |
|---|---|---|---|
| Previous Owner | White Kimberly S | $92,000 |
Source: Public Records
Tax History
| Year | Tax Paid | Tax Assessment Tax Assessment Total Assessment is a certain percentage of the fair market value that is determined by local assessors to be the total taxable value of land and additions on the property. | Land | Improvement |
|---|---|---|---|---|
| 2025 | $2,241 | $325,780 | $119,191 | $206,589 |
| 2024 | $2,257 | $178,839 | $65,554 | $113,285 |
| 2023 | $1,843 | $155,103 | $60,699 | $94,404 |
| 2022 | $925 | $125,235 | $38,814 | $86,421 |
| 2021 | $911 | $185,226 | $54,285 | $130,941 |
| 2020 | $910 | $178,601 | $56,347 | $122,254 |
| 2019 | $936 | $178,601 | $56,347 | $122,254 |
| 2018 | $835 | $157,928 | $46,956 | $110,972 |
| 2017 | $722 | $130,703 | $36,120 | $94,583 |
| 2016 | $679 | $119,579 | $30,100 | $89,479 |
| 2015 | $623 | $111,345 | $30,100 | $81,245 |
| 2014 | $623 | $109,465 | $39,123 | $70,342 |
| 2013 | -- | $60,206 | $0 | $0 |
Source: Public Records
Map
Nearby Homes
- 3770 E Juniper Cliffs Dr
- 3976 Juniper Cliffs Dr
- 1286 S Knoll
- 1286 S Knoll Unit 6-191
- Lot 10 Silver Dawn Cir
- 0 E Jackson Ct
- 4395 E Mountain View Dr Unit C-77
- 0 Crimson Estates Lot 36 Unit 24-256080
- 4225 Blue Sky
- 1448 S Sage Ct
- 3100 Ryker
- 4210 Star Gazer Cir
- 4441 Red Cliffs Dr
- Lot 30 Mule Deer Cir
- 0 Lot 27 Crimson Estates Unit 1409079
- 1780 Crimson Rd
- 4377 E Colt Cir
- 4377/4375 E Colt Cir
- 4225 E Star Gazer Cir
- 4210 E Milky Way Cir
- 3710 E Juniper Cliffs Dr
- 3721 E Juniper Cliffs Dr
- 3670 E Juniper Cliffs Dr
- 3697 E Mountain View Dr
- E Juniper Cliffs Dr
- 3795 E Mountain View Dr
- 3761 E Juniper Cliffs Dr
- 3695 E Juniper Cliffs Dr
- 3825 E Juniper Cliffs Dr
- 3795 E Juniper Cliffs Dr
- 0 E Juniper Cliffs Dr Unit 22-233967
- 0 E Juniper Cliffs Dr Unit 20-217583
- 0 E Juniper Cliffs Dr Unit 39 1829561
- 3841 E Juniper Cliffs Dr
- 3855 E Mountain View Dr Unit 50
- 3620 E Highway 89
- 1345 S 3600 E
- 3875 E Juniper Cliffs Dr
- 3895 E Juniper Cliffs Dr
- 1245 S 3600 E
Your Personal Tour Guide
Ask me questions while you tour the home.