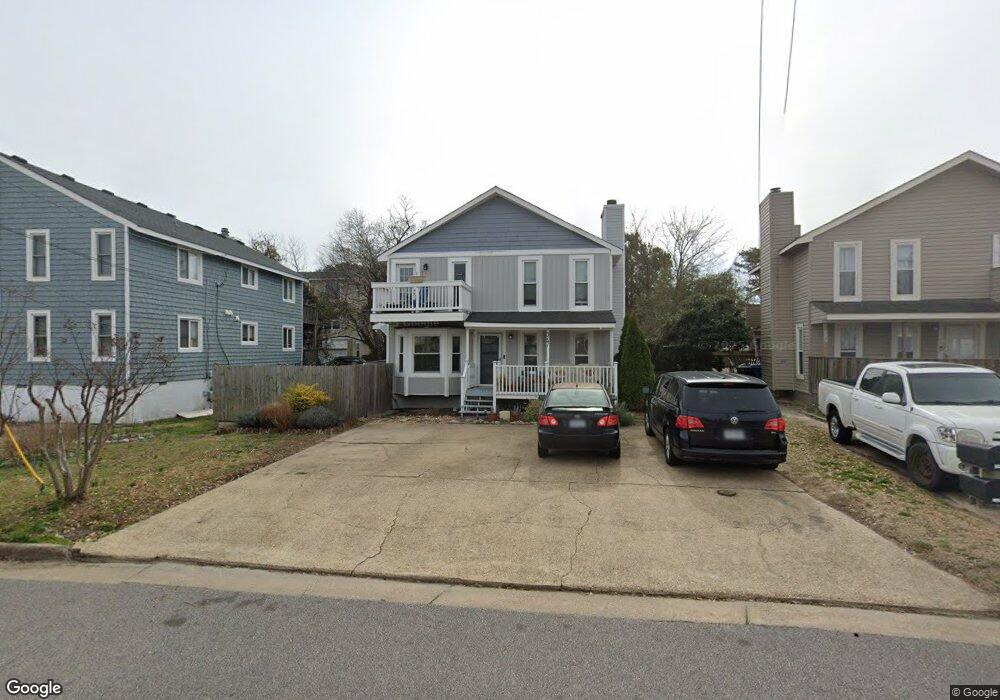
3741 Clipper Bay Dr Virginia Beach, VA 23455
Ocean Park NeighborhoodEstimated Value: $397,000 - $461,000
2
Beds
2
Baths
1,302
Sq Ft
$325/Sq Ft
Est. Value
About This Home
This home is located at 3741 Clipper Bay Dr, Virginia Beach, VA 23455 and is currently estimated at $422,522, approximately $324 per square foot. 3741 Clipper Bay Dr is a home located in Virginia Beach City with nearby schools including Thoroughgood Elementary School, Great Neck Middle School, and Frank W. Cox High School.
Ownership History
Date
Name
Owned For
Owner Type
Purchase Details
Closed on
Dec 18, 2013
Sold by
Fass Geraldine A
Bought by
Herana Kelly A
Current Estimated Value
Home Financials for this Owner
Home Financials are based on the most recent Mortgage that was taken out on this home.
Original Mortgage
$175,500
Outstanding Balance
$131,587
Interest Rate
4.29%
Mortgage Type
New Conventional
Estimated Equity
$290,935
Purchase Details
Closed on
Jan 8, 2003
Sold by
Rickel Michael S
Bought by
Fass Geraldine A
Home Financials for this Owner
Home Financials are based on the most recent Mortgage that was taken out on this home.
Original Mortgage
$67,500
Interest Rate
6.19%
Mortgage Type
New Conventional
Purchase Details
Closed on
Nov 4, 1998
Sold by
Fuentes-Bermudez Pedro
Bought by
Rickel Michael S
Home Financials for this Owner
Home Financials are based on the most recent Mortgage that was taken out on this home.
Original Mortgage
$90,250
Interest Rate
6.64%
Create a Home Valuation Report for This Property
The Home Valuation Report is an in-depth analysis detailing your home's value as well as a comparison with similar homes in the area
Home Values in the Area
Average Home Value in this Area
Purchase History
| Date | Buyer | Sale Price | Title Company |
|---|---|---|---|
| Herana Kelly A | $195,000 | -- | |
| Fass Geraldine A | $135,000 | -- | |
| Rickel Michael S | $88,500 | -- |
Source: Public Records
Mortgage History
| Date | Status | Borrower | Loan Amount |
|---|---|---|---|
| Open | Herana Kelly A | $175,500 | |
| Previous Owner | Fass Geraldine A | $67,500 | |
| Previous Owner | Rickel Michael S | $90,250 |
Source: Public Records
Tax History Compared to Growth
Tax History
| Year | Tax Paid | Tax Assessment Tax Assessment Total Assessment is a certain percentage of the fair market value that is determined by local assessors to be the total taxable value of land and additions on the property. | Land | Improvement |
|---|---|---|---|---|
| 2025 | $4,026 | $414,500 | $300,000 | $114,500 |
| 2024 | $4,026 | $415,000 | $300,000 | $115,000 |
| 2023 | $3,363 | $339,700 | $228,200 | $111,500 |
| 2022 | $2,998 | $302,800 | $198,900 | $103,900 |
| 2021 | $2,511 | $253,600 | $161,900 | $91,700 |
| 2020 | $2,565 | $252,100 | $161,900 | $90,200 |
| 2019 | $2,557 | $246,300 | $161,900 | $84,400 |
| 2018 | $2,469 | $246,300 | $161,900 | $84,400 |
| 2017 | $2,469 | $246,300 | $161,900 | $84,400 |
| 2016 | $2,400 | $242,400 | $158,000 | $84,400 |
| 2015 | $2,427 | $245,100 | $158,000 | $87,100 |
| 2014 | $2,113 | $229,800 | $158,000 | $71,800 |
Source: Public Records
Map
Nearby Homes
- 3751 Clipper Bay Dr
- 3718 Pendleton Ave
- 2204 Roanoke Ave Unit B
- 2217 Roanoke Ave Unit X6013
- 3730 Chesterfield Ave
- 2205 Dinwiddie Rd
- 3558 Shore Dr Unit 905
- 3558 Shore Dr Unit 903
- 2089 Tazewell Rd Unit X2331
- 2082 Tazewell Rd
- 2367 Madison Ave Unit X4034
- 3556 Shore Dr Unit 705
- 3556 Shore Dr Unit 801
- 3556 Shore Dr Unit 1005
- 3556 Shore Dr Unit 704
- 3556 Shore Dr Unit 804
- 3991 W Stratford Rd
- 2305 Purple Martin Ln
- 3944 Whispering Oaks Place
- 2325 Point Chesapeake Quay Unit 5013
- 3741 Clipper Bay Dr Unit 3741
- 3745 Clipper Bay Dr
- 3747 Clipper Bay Dr
- 3747 Clipper Bay Dr Unit BACK
- 3743 Clipper Bay Dr
- 3737 Clipper Bay Dr
- 3724 Clipper Bay Dr
- 3714 Clipper Bay Dr
- 3712 Clipper Bay Dr
- 3708 Clipper Bay Dr
- 3738 Pendleton Ave
- 3744 Pendleton Ave
- 3753 Clipper Bay Dr
- 3761 E Stratford Rd Unit B
- 3761 E Stratford Rd Unit A
- 3761 E Stratford Rd
- 3767 E Stratford Rd
- 3765 E Stratford Rd
- 3720 Clipper Bay Dr
- 3759 E Stratford Rd