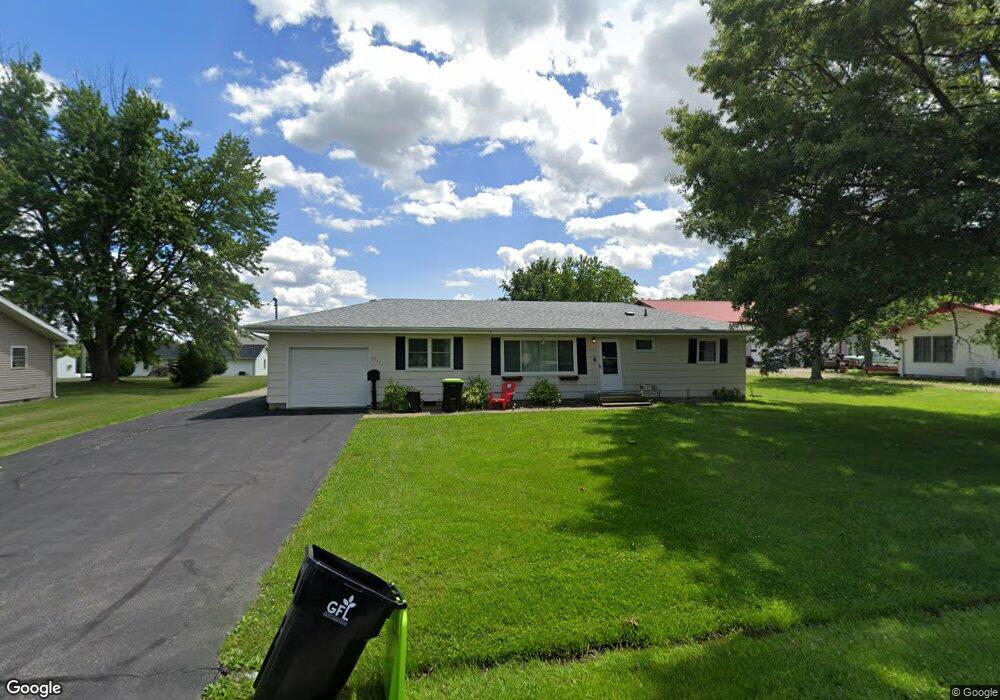
3741 E Glenwood Dr Decatur, IL 62521
Greenlake NeighborhoodEstimated Value: $141,564 - $163,000
3
Beds
1
Bath
1,152
Sq Ft
$133/Sq Ft
Est. Value
About This Home
This home is located at 3741 E Glenwood Dr, Decatur, IL 62521 and is currently estimated at $153,141, approximately $132 per square foot. 3741 E Glenwood Dr is a home located in Macon County with nearby schools including McGaughey Elementary School, Mt. Zion Elementary School, and Mt. Zion Intermediate School.
Ownership History
Date
Name
Owned For
Owner Type
Purchase Details
Closed on
Dec 21, 2020
Sold by
Mccoy Jessica A
Bought by
Harmon Danielle
Current Estimated Value
Home Financials for this Owner
Home Financials are based on the most recent Mortgage that was taken out on this home.
Original Mortgage
$101,650
Outstanding Balance
$90,660
Interest Rate
2.8%
Mortgage Type
New Conventional
Estimated Equity
$62,481
Purchase Details
Closed on
Sep 7, 2018
Sold by
Niebrugge Timothy D
Bought by
Keller Jessica A
Home Financials for this Owner
Home Financials are based on the most recent Mortgage that was taken out on this home.
Original Mortgage
$96,224
Interest Rate
4.87%
Mortgage Type
FHA
Purchase Details
Closed on
Apr 6, 2012
Sold by
Marucco Terence A
Bought by
Niebrugge Timothy D
Home Financials for this Owner
Home Financials are based on the most recent Mortgage that was taken out on this home.
Original Mortgage
$77,600
Interest Rate
3.92%
Mortgage Type
Future Advance Clause Open End Mortgage
Create a Home Valuation Report for This Property
The Home Valuation Report is an in-depth analysis detailing your home's value as well as a comparison with similar homes in the area
Home Values in the Area
Average Home Value in this Area
Purchase History
| Date | Buyer | Sale Price | Title Company |
|---|---|---|---|
| Harmon Danielle | $107,000 | None Available | |
| Keller Jessica A | $98,000 | None Available | |
| Niebrugge Timothy D | $73,000 | None Available |
Source: Public Records
Mortgage History
| Date | Status | Borrower | Loan Amount |
|---|---|---|---|
| Open | Harmon Danielle | $101,650 | |
| Previous Owner | Keller Jessica A | $96,224 | |
| Previous Owner | Niebrugge Timothy D | $77,600 |
Source: Public Records
Tax History Compared to Growth
Tax History
| Year | Tax Paid | Tax Assessment Tax Assessment Total Assessment is a certain percentage of the fair market value that is determined by local assessors to be the total taxable value of land and additions on the property. | Land | Improvement |
|---|---|---|---|---|
| 2024 | $2,016 | $38,070 | $5,318 | $32,752 |
| 2023 | $1,938 | $35,374 | $4,941 | $30,433 |
| 2022 | $1,805 | $33,259 | $4,645 | $28,614 |
| 2021 | $1,739 | $31,531 | $4,404 | $27,127 |
| 2020 | $1,659 | $30,135 | $4,209 | $25,926 |
| 2019 | $1,659 | $30,135 | $4,209 | $25,926 |
| 2018 | $2,024 | $29,475 | $4,117 | $25,358 |
| 2017 | $2,018 | $29,111 | $4,066 | $25,045 |
| 2016 | $2,018 | $29,094 | $4,064 | $25,030 |
| 2015 | $1,233 | $28,721 | $4,012 | $24,709 |
| 2014 | $1,197 | $28,721 | $4,012 | $24,709 |
| 2013 | $1,218 | $28,721 | $4,012 | $24,709 |
Source: Public Records
Map
Nearby Homes
- 2554 S Nantucket Dr
- 2488 S Fontaine Dr
- 2504 S Nantucket Dr
- 2571 Lansdowne Dr
- 2458 Quail Dr
- 3405 Fontenac Ct
- 3330 S Baltimore Ave
- 3172 Redlich Dr
- 3290 E Fitzgerald Rd
- 3210 Fields Ct
- 3552 E Orchard Dr
- 1968 S Baltimore Ave
- 4090 S Lake Ct
- 3109 E Cherry Dr
- 2110 Buckhead Ln
- 2125 Buckhead Ave
- 2035 Buckhead Blvd
- 1748 S Montrose Ave
- 9 Blakeridge Place
- 3645 E Fulton Ave
- 3725 E Glenwood Dr
- 3809 E Glenwood Dr
- 3815 E Glenwood Dr
- 3740 E Glenwood Dr
- 3709 E Glenwood Dr
- 3726 E Glenwood Dr
- 3712 E Glenwood Dr
- 3810 E Glenwood Dr
- 3820 E Glenwood Dr
- 3750 E Lost Bridge Rd
- 2739 S Baltimore Ave
- 2624 S Montrose Ave
- 2735 S Baltimore Ave
- 2614 S Montrose Ave
- 2717 S Baltimore Ave
- 2637 S Baltimore Ave
- 2820 S Baltimore Ave
- 2750 S Baltimore Ave
- 2615 S Montrose Ave
- 2604 S Montrose Ave