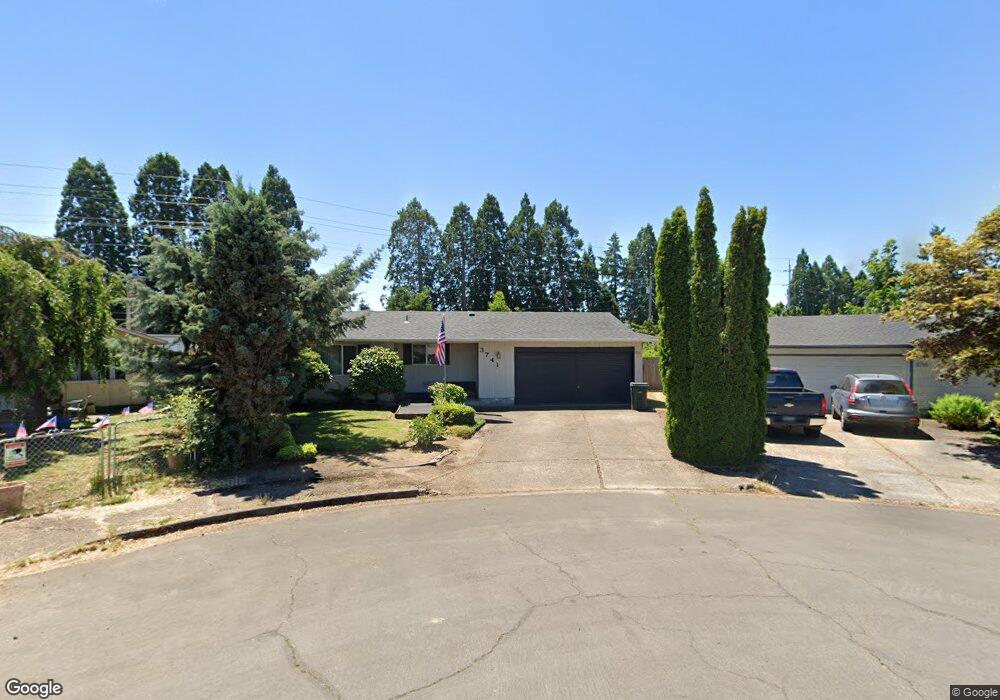
3741 S E St Springfield, OR 97478
East Springfield NeighborhoodEstimated Value: $333,000 - $366,387
3
Beds
1
Bath
1,041
Sq Ft
$342/Sq Ft
Est. Value
About This Home
This home is located at 3741 S E St, Springfield, OR 97478 and is currently estimated at $355,847, approximately $341 per square foot. 3741 S E St is a home located in Lane County with nearby schools including Douglas Gardens Elementary School, Agnes Stewart Middle School, and Springfield High School.
Ownership History
Date
Name
Owned For
Owner Type
Purchase Details
Closed on
Nov 5, 2025
Sold by
Adams Living Trust and Lee Rose Lynda
Bought by
Eric Kevin Steele Trust and Rose
Current Estimated Value
Purchase Details
Closed on
Oct 4, 2006
Sold by
Marelli Charles A and Marelli Margie R
Bought by
Adams Norma Jean and Adams Living Trust
Purchase Details
Closed on
Jun 22, 2006
Sold by
Widener Deborah Lee and Gamble Jeri Fae
Bought by
Marelli Charles A and Marelli Margie R
Create a Home Valuation Report for This Property
The Home Valuation Report is an in-depth analysis detailing your home's value as well as a comparison with similar homes in the area
Home Values in the Area
Average Home Value in this Area
Purchase History
| Date | Buyer | Sale Price | Title Company |
|---|---|---|---|
| Eric Kevin Steele Trust | -- | None Listed On Document | |
| Adams Norma Jean | $162,500 | Fidelity National Title Insu | |
| Marelli Charles A | $139,500 | Cascade Title Co |
Source: Public Records
Tax History
| Year | Tax Paid | Tax Assessment Tax Assessment Total Assessment is a certain percentage of the fair market value that is determined by local assessors to be the total taxable value of land and additions on the property. | Land | Improvement |
|---|---|---|---|---|
| 2025 | $2,962 | $161,517 | -- | -- |
| 2024 | $2,914 | $156,813 | -- | -- |
| 2023 | $2,914 | $152,246 | $0 | $0 |
| 2022 | $2,699 | $147,812 | $0 | $0 |
| 2021 | $2,650 | $143,507 | $0 | $0 |
| 2020 | $2,573 | $139,328 | $0 | $0 |
| 2019 | $2,496 | $135,270 | $0 | $0 |
| 2018 | $2,352 | $127,506 | $0 | $0 |
| 2017 | $2,262 | $127,506 | $0 | $0 |
| 2016 | $2,215 | $123,792 | $0 | $0 |
| 2015 | $2,151 | $120,186 | $0 | $0 |
| 2014 | $2,119 | $116,685 | $0 | $0 |
Source: Public Records
Map
Nearby Homes
Your Personal Tour Guide
Ask me questions while you tour the home.