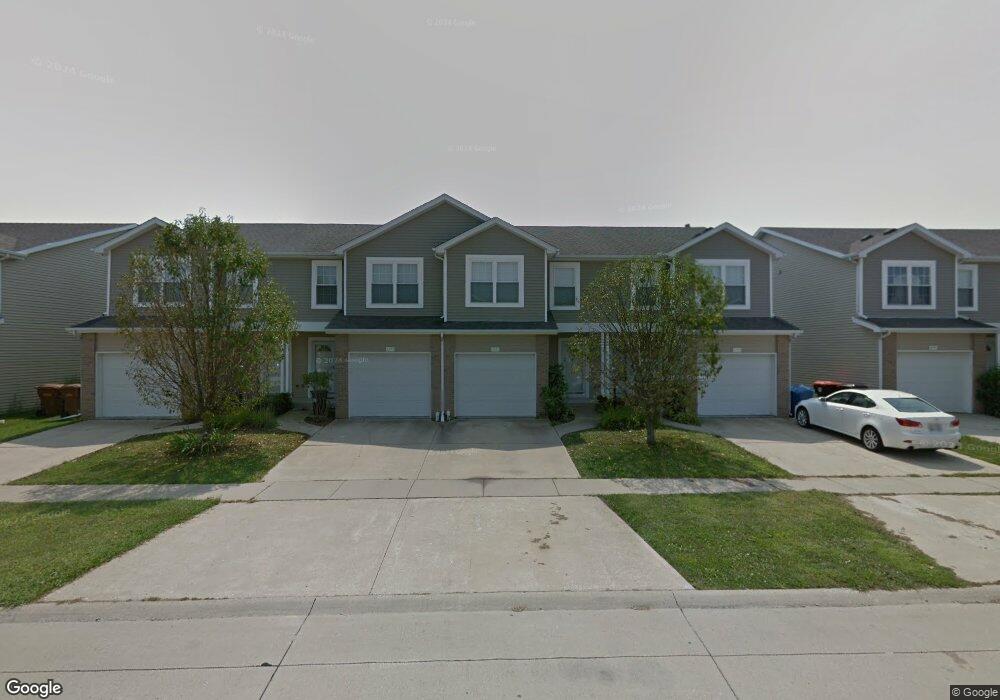
3741 Summer Sage Ct Champaign, IL 61822
Sawgrass NeighborhoodEstimated Value: $185,000 - $231,000
2
Beds
3
Baths
1,332
Sq Ft
$161/Sq Ft
Est. Value
About This Home
This home is located at 3741 Summer Sage Ct, Champaign, IL 61822 and is currently estimated at $214,894, approximately $161 per square foot. 3741 Summer Sage Ct is a home located in Champaign County with nearby schools including Centennial High School, Swann Special Care Center-Elem/Secondary School, and Countryside School.
Ownership History
Date
Name
Owned For
Owner Type
Purchase Details
Closed on
Jan 26, 2022
Sold by
Vasica James J
Bought by
Wilson-Barker Enterprise Llc
Current Estimated Value
Home Financials for this Owner
Home Financials are based on the most recent Mortgage that was taken out on this home.
Original Mortgage
$98,400
Outstanding Balance
$90,267
Interest Rate
3.22%
Mortgage Type
New Conventional
Estimated Equity
$124,627
Purchase Details
Closed on
Mar 9, 2010
Sold by
Hubbard Donald M and Hubbard Susan R
Bought by
Vasica James J
Home Financials for this Owner
Home Financials are based on the most recent Mortgage that was taken out on this home.
Original Mortgage
$13,000
Interest Rate
4.33%
Mortgage Type
Stand Alone Second
Purchase Details
Closed on
Nov 22, 2005
Sold by
Web Construction Co
Bought by
Hubbard Donald and Hubbard Susan
Create a Home Valuation Report for This Property
The Home Valuation Report is an in-depth analysis detailing your home's value as well as a comparison with similar homes in the area
Home Values in the Area
Average Home Value in this Area
Purchase History
| Date | Buyer | Sale Price | Title Company |
|---|---|---|---|
| Wilson-Barker Enterprise Llc | $123,000 | None Listed On Document | |
| Vasica James J | $131,000 | None Available | |
| Hubbard Donald | $134,500 | -- |
Source: Public Records
Mortgage History
| Date | Status | Borrower | Loan Amount |
|---|---|---|---|
| Open | Wilson-Barker Enterprise Llc | $98,400 | |
| Previous Owner | Vasica James J | $13,000 | |
| Previous Owner | Vasica James J | $104,800 |
Source: Public Records
Tax History
| Year | Tax Paid | Tax Assessment Tax Assessment Total Assessment is a certain percentage of the fair market value that is determined by local assessors to be the total taxable value of land and additions on the property. | Land | Improvement |
|---|---|---|---|---|
| 2024 | $4,409 | $60,270 | $5,380 | $54,890 |
| 2023 | $4,409 | $54,890 | $4,900 | $49,990 |
| 2022 | $4,105 | $50,640 | $4,520 | $46,120 |
| 2021 | $3,996 | $49,650 | $4,430 | $45,220 |
| 2020 | $3,827 | $47,740 | $4,260 | $43,480 |
| 2019 | $3,693 | $46,760 | $4,170 | $42,590 |
| 2018 | $3,601 | $46,020 | $4,100 | $41,920 |
| 2017 | $3,456 | $44,250 | $3,940 | $40,310 |
| 2016 | $3,089 | $43,340 | $3,860 | $39,480 |
| 2015 | $3,103 | $42,570 | $3,790 | $38,780 |
| 2014 | $3,076 | $42,570 | $3,790 | $38,780 |
| 2013 | $3,049 | $42,570 | $3,790 | $38,780 |
Source: Public Records
Map
Nearby Homes
- 3724 Summer Sage Ct
- 3920 Trailway Dr
- 1404 Bluegrass Ln
- 1407 Sand Dollar Dr
- 709 Erin Dr
- 1409 Sand Dollar Dr
- 1413 Sand Dollar Dr
- 3712 Lighthouse Pointe
- 3710 Lighthouse Pointe
- 616 Erin Dr
- 6 lots Boulder Ridge Dr
- 1328 W Ridge Ln
- 3420 Stoneway Ct
- 3909 Slate Dr
- 4011 Tallgrass Dr
- 3810 Obsidian Dr
- 509 Crestwood Dr
- 1003 Cyndy Ct
- 1504 Greyrock Ln
- 610 Sedgegrass Dr
- 3739 Summer Sage Ct
- 3743 Summer Sage Ct
- 3737 Summer Sage Ct
- 3745 Summer Sage Ct
- 3735 Summer Sage Ct
- 3747 Summer Sage Ct
- 3733 Summer Sage Ct
- 3749 Summer Sage Ct
- 3731 Summer Sage Ct
- 842 Sedgegrass Dr
- 3751 Summer Sage Ct
- 840 Sedgegrass Dr
- 844 Sedgegrass Dr
- 844 Sedgegrass Dr Unit 1
- 3729 Summer Sage Ct
- 838 Sedgegrass Dr
- 3727 Summer Sage Ct
- 846 Sedgegrass Dr
- 3742 Summer Sage Ct
- 3740 Summer Sage Ct
Your Personal Tour Guide
Ask me questions while you tour the home.