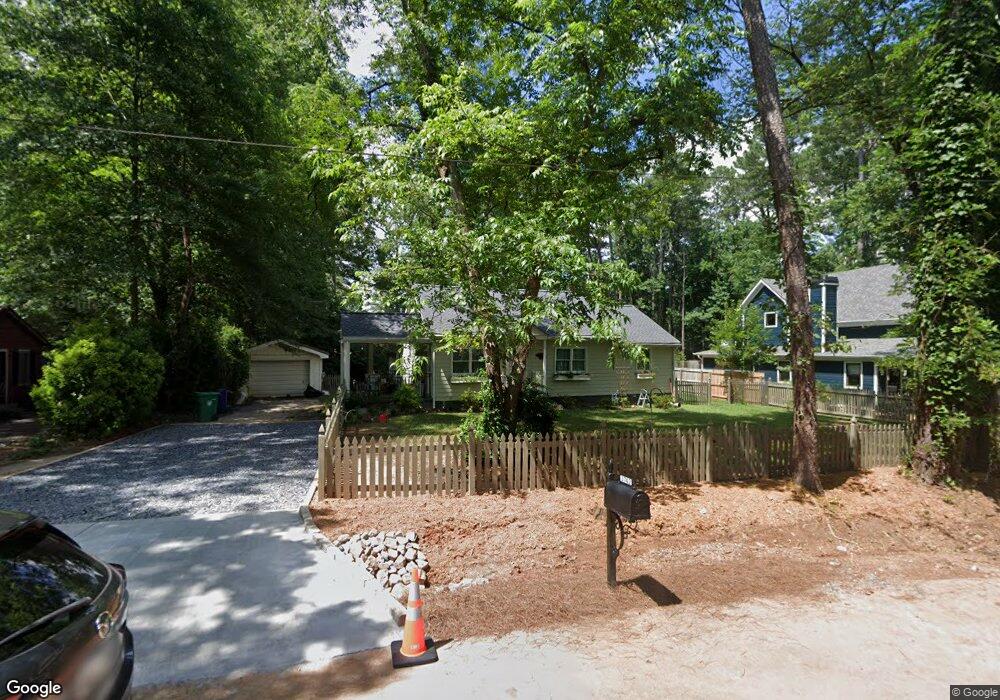
3742 Bailey Rd Tucker, GA 30084
Estimated Value: $356,000 - $372,858
3
Beds
2
Baths
1,605
Sq Ft
$226/Sq Ft
Est. Value
About This Home
This home is located at 3742 Bailey Rd, Tucker, GA 30084 and is currently estimated at $363,215, approximately $226 per square foot. 3742 Bailey Rd is a home located in DeKalb County with nearby schools including Brockett Elementary School, Tucker Middle School, and Tucker High School.
Ownership History
Date
Name
Owned For
Owner Type
Purchase Details
Closed on
Sep 28, 2006
Sold by
Secretary Of Hud
Bought by
Fike Lucy V
Current Estimated Value
Home Financials for this Owner
Home Financials are based on the most recent Mortgage that was taken out on this home.
Original Mortgage
$111,447
Interest Rate
6.31%
Mortgage Type
FHA
Purchase Details
Closed on
Jan 3, 2006
Sold by
Wells Fargo Bk Na
Bought by
Secretary Of Hud
Purchase Details
Closed on
Aug 24, 2001
Sold by
S & T One Holdings Llc +
Bought by
Cuautle Jose S
Home Financials for this Owner
Home Financials are based on the most recent Mortgage that was taken out on this home.
Original Mortgage
$157,429
Interest Rate
6.49%
Mortgage Type
FHA
Purchase Details
Closed on
Sep 5, 2000
Sold by
Winkles Linda M and Winkles Jack
Bought by
S & Tonie Holdings & S A Holding
Create a Home Valuation Report for This Property
The Home Valuation Report is an in-depth analysis detailing your home's value as well as a comparison with similar homes in the area
Home Values in the Area
Average Home Value in this Area
Purchase History
| Date | Buyer | Sale Price | Title Company |
|---|---|---|---|
| Fike Lucy V | -- | -- | |
| Secretary Of Hud | -- | -- | |
| Wells Fargo Bk Na | $160,715 | -- | |
| Cuautle Jose S | -- | -- | |
| Cuautle Jose S | $159,900 | -- | |
| S & Tonie Holdings & S A Holding | $66,601 | -- |
Source: Public Records
Mortgage History
| Date | Status | Borrower | Loan Amount |
|---|---|---|---|
| Previous Owner | Fike Lucy V | $111,447 | |
| Previous Owner | Cuautle Jose S | $157,429 |
Source: Public Records
Tax History Compared to Growth
Tax History
| Year | Tax Paid | Tax Assessment Tax Assessment Total Assessment is a certain percentage of the fair market value that is determined by local assessors to be the total taxable value of land and additions on the property. | Land | Improvement |
|---|---|---|---|---|
| 2025 | $7,308 | $152,840 | $36,000 | $116,840 |
| 2024 | $7,025 | $148,320 | $36,000 | $112,320 |
| 2023 | $7,025 | $136,320 | $36,000 | $100,320 |
| 2022 | $5,757 | $125,040 | $27,520 | $97,520 |
| 2021 | $4,575 | $96,440 | $27,520 | $68,920 |
| 2020 | $3,971 | $83,800 | $17,320 | $66,480 |
| 2019 | $3,953 | $83,480 | $17,320 | $66,160 |
| 2018 | $3,337 | $70,960 | $17,320 | $53,640 |
| 2017 | $3,454 | $71,240 | $17,320 | $53,920 |
| 2016 | $3,687 | $76,360 | $17,320 | $59,040 |
| 2014 | $2,045 | $38,240 | $17,320 | $20,920 |
Source: Public Records
Map
Nearby Homes
- 1608 Cooledge Rd
- 1661 Avon Ave
- 3788 Sarahs Ln
- 3636 Castle Rock Way
- 1661 Zemory Dr
- 1864 Stockton Dr
- 3718 Sheridan St
- 3630 Prince Way
- 3620 Wind River Ct
- 3952 Cedar Cir
- 3722 S Marlborough Dr
- 1894 Hebron Hills Dr
- 1905 Robinhill Ct
- 3533 Johns Rd
- 3965 Camelot Ct
- 1517 Vancouver Dr
- 1926 Brocken Way
- 3453 Woodlawn Cir
- 3740 Bailey Rd
- 3752 Bailey Rd
- 3737 Gloucester Dr
- 3745 Gloucester Dr
- 3745 Gloucester Dr Unit 2
- 3745 Bailey Rd
- 3755 Bailey Rd
- 0 Bailey Rd
- 3753 Gloucester Dr
- 1684 Stanwyck Terrace
- 1690 Stanwyck Terrace
- 1678 Stanwyck Terrace
- 3737 Bailey Rd
- 1696 Stanwyck Terrace
- 1670 Stanwyck Terrace
- 3727 Bailey Rd
- 3763 Gloucester Dr
- 1685 Cooledge Rd
- 0 Stanwyck Terrace Unit 8210744
- 0 Stanwyck Terrace Unit 3148199