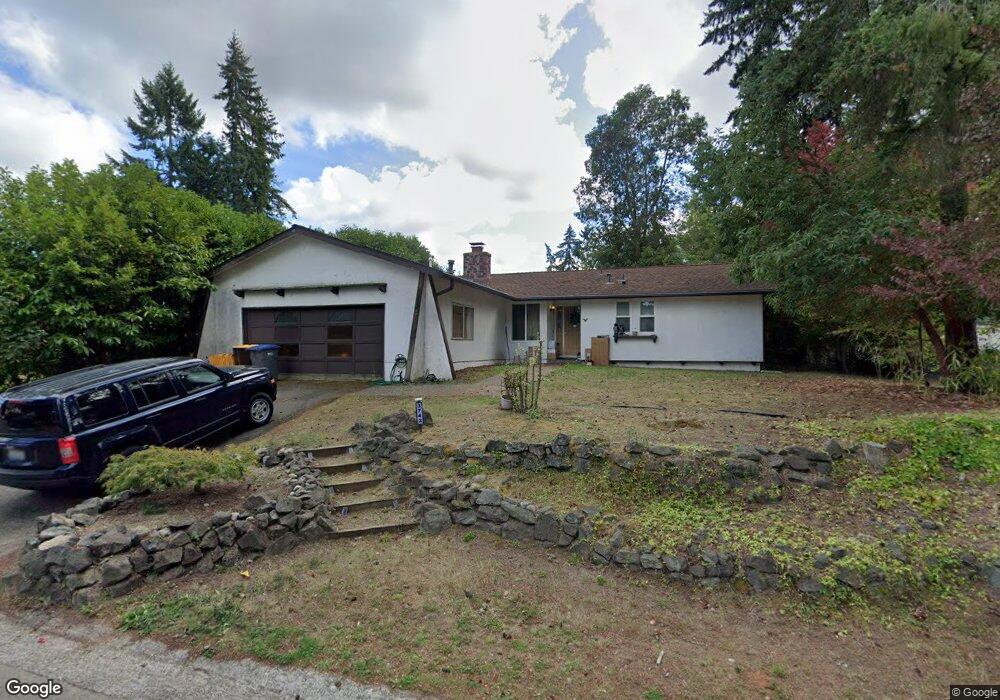
3742 SE Ardenwald Place Port Orchard, WA 98366
Parkwood NeighborhoodEstimated Value: $445,535 - $464,000
3
Beds
2
Baths
1,355
Sq Ft
$334/Sq Ft
Est. Value
About This Home
This home is located at 3742 SE Ardenwald Place, Port Orchard, WA 98366 and is currently estimated at $452,884, approximately $334 per square foot. 3742 SE Ardenwald Place is a home located in Kitsap County with nearby schools including Orchard Heights Elementary School, Marcus Whitman Middle School, and South Kitsap High School.
Ownership History
Date
Name
Owned For
Owner Type
Purchase Details
Closed on
May 1, 2024
Sold by
Gordon Gerald Cornelius
Bought by
Heath Brandi
Current Estimated Value
Purchase Details
Closed on
Mar 28, 2013
Sold by
Gordon Gerald C
Bought by
Heath Brandi and Gordon Gerald
Purchase Details
Closed on
Jul 27, 2009
Sold by
Sandbeck Fletcher
Bought by
Gordon Gerald C
Home Financials for this Owner
Home Financials are based on the most recent Mortgage that was taken out on this home.
Original Mortgage
$201,235
Interest Rate
5.31%
Mortgage Type
VA
Purchase Details
Closed on
Mar 20, 1998
Sold by
Sanders Susan Kay and Kinzel Robert C
Bought by
Sanders Kinzel Susan Kay
Purchase Details
Closed on
Jul 6, 1994
Sold by
Kinzel Susan E
Bought by
Kinzel Robert C
Create a Home Valuation Report for This Property
The Home Valuation Report is an in-depth analysis detailing your home's value as well as a comparison with similar homes in the area
Home Values in the Area
Average Home Value in this Area
Purchase History
| Date | Buyer | Sale Price | Title Company |
|---|---|---|---|
| Heath Brandi | $313 | None Listed On Document | |
| Heath Brandi | -- | None Available | |
| Gordon Gerald C | $197,280 | Land Title | |
| Sanders Kinzel Susan Kay | -- | -- | |
| Kinzel Robert C | -- | Transamerica Title Services |
Source: Public Records
Mortgage History
| Date | Status | Borrower | Loan Amount |
|---|---|---|---|
| Previous Owner | Gordon Gerald C | $201,235 |
Source: Public Records
Tax History Compared to Growth
Tax History
| Year | Tax Paid | Tax Assessment Tax Assessment Total Assessment is a certain percentage of the fair market value that is determined by local assessors to be the total taxable value of land and additions on the property. | Land | Improvement |
|---|---|---|---|---|
| 2026 | $3,185 | $385,610 | $71,200 | $314,410 |
| 2025 | $3,185 | $359,020 | $61,720 | $297,300 |
| 2024 | $3,089 | $359,020 | $61,720 | $297,300 |
| 2023 | $3,068 | $359,020 | $61,720 | $297,300 |
| 2022 | $3,015 | $295,760 | $57,640 | $238,120 |
| 2021 | $2,897 | $268,990 | $53,560 | $215,430 |
| 2020 | $2,847 | $256,900 | $51,010 | $205,890 |
| 2019 | $2,414 | $238,450 | $50,080 | $188,370 |
| 2018 | $2,527 | $194,070 | $50,080 | $143,990 |
| 2017 | $2,165 | $194,070 | $50,080 | $143,990 |
| 2016 | $2,116 | $173,500 | $50,080 | $123,420 |
| 2015 | $2,048 | $170,250 | $50,080 | $120,170 |
| 2014 | -- | $167,000 | $50,080 | $116,920 |
| 2013 | -- | $163,310 | $52,720 | $110,590 |
Source: Public Records
Map
Nearby Homes
- 3697 SE Ardenwald Place
- 3696 SE Greenbriar Place
- 3873 Canterbury Place SE
- 3628 Creek View Ct SE
- 3300 Madrona Dr SE
- 2863 Rocky Creek Ln SE
- 3929 Briarwood Dr SE
- 4592 SE Basswood Ln
- 3258 SE Mahali Ln
- 3589 SE Pine Tree Dr
- 2169 Ponderosa Dr SE
- 2315 SE Kelby Cir
- 1703 Harrison Ave SE
- 1663 Harrison Ave SE
- 3900 SE Mile Hill Dr
- 3930 SE Mile Hill Dr
- 2723 Lincoln Ave SE
- 3157 SE Villa Carmel Dr
- 0 Lincoln Ave SE
- 5101 SE Natchez Ct
- 3756 SE Ardenwald Place
- 3704 SE Ardenwald Place
- 3709 SE Buckingham Dr
- 3691 SE Buckingham Dr
- 3739 SE Ardenwald Place
- 3727 SE Buckingham Dr
- 3768 SE Ardenwald Place
- 3725 SE Ardenwald Place
- 3753 SE Ardenwald Place
- 3679 SE Buckingham Dr
- 3741 SE Buckingham Dr
- 3782 SE Ardenwald Place
- 3767 SE Ardenwald Place
- 3781 SE Ardenwald Place
- 3742 SE Conifer Park Dr
- 3683 SE Ardenwald Place
- 3764 SE Conifer Park Dr
- 3714 SE Buckingham Dr
- 3700 SE Buckingham Dr
- 3759 SE Buckingham Dr