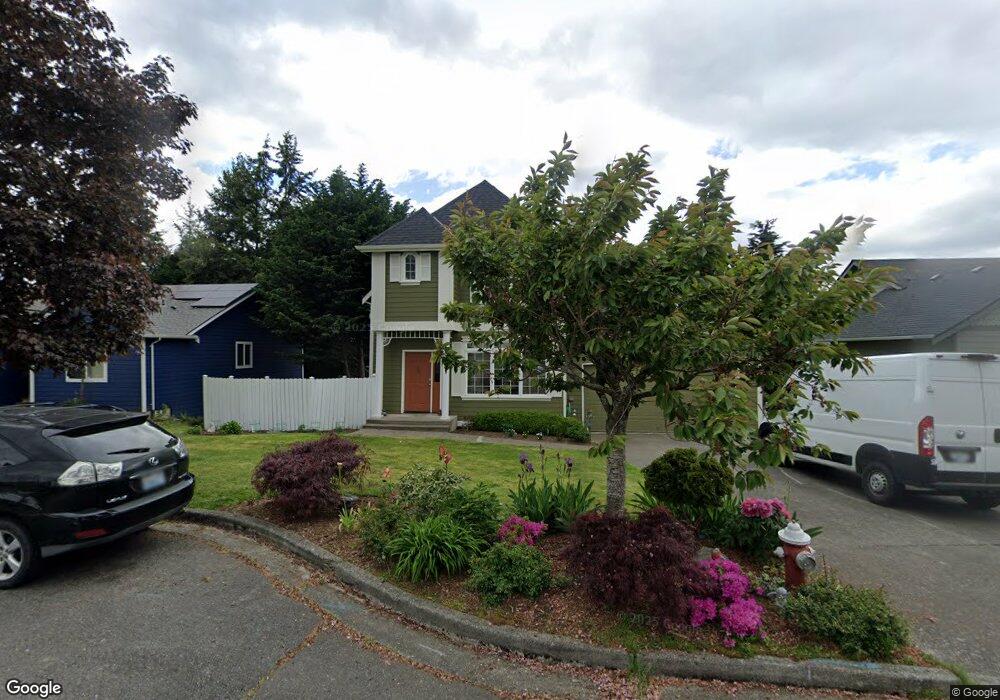
3743 N Heather Place Bellingham, WA 98226
Barkley NeighborhoodEstimated Value: $785,000 - $931,000
3
Beds
2
Baths
1,842
Sq Ft
$459/Sq Ft
Est. Value
About This Home
This home is located at 3743 N Heather Place, Bellingham, WA 98226 and is currently estimated at $844,723, approximately $458 per square foot. 3743 N Heather Place is a home located in Whatcom County with nearby schools including Northern Heights Elementary School, Shuksan Middle School, and Squalicum High School.
Ownership History
Date
Name
Owned For
Owner Type
Purchase Details
Closed on
Apr 24, 2015
Sold by
Zhao Zeng Hong
Bought by
Huang Jie
Current Estimated Value
Purchase Details
Closed on
May 28, 2013
Sold by
Huang Jie
Bought by
Zhao Zeng Hong
Purchase Details
Closed on
Mar 8, 2007
Sold by
Munckton John W and Munckton Deirdre
Bought by
Huang Jie and Zhao Zeng Hong
Home Financials for this Owner
Home Financials are based on the most recent Mortgage that was taken out on this home.
Original Mortgage
$285,300
Interest Rate
6%
Mortgage Type
Purchase Money Mortgage
Purchase Details
Closed on
Apr 26, 2000
Sold by
Smyth David and Smyth Angela L
Bought by
Munckton John Wm and Munckton Deirdre
Home Financials for this Owner
Home Financials are based on the most recent Mortgage that was taken out on this home.
Original Mortgage
$180,000
Interest Rate
7.83%
Create a Home Valuation Report for This Property
The Home Valuation Report is an in-depth analysis detailing your home's value as well as a comparison with similar homes in the area
Home Values in the Area
Average Home Value in this Area
Purchase History
| Date | Buyer | Sale Price | Title Company |
|---|---|---|---|
| Huang Jie | -- | None Available | |
| Zhao Zeng Hong | -- | None Available | |
| Huang Jie | $380,780 | Chicago Title Insurance | |
| Munckton John Wm | $232,000 | Charter Title Corporation |
Source: Public Records
Mortgage History
| Date | Status | Borrower | Loan Amount |
|---|---|---|---|
| Previous Owner | Huang Jie | $285,300 | |
| Previous Owner | Munckton John Wm | $180,000 |
Source: Public Records
Tax History Compared to Growth
Tax History
| Year | Tax Paid | Tax Assessment Tax Assessment Total Assessment is a certain percentage of the fair market value that is determined by local assessors to be the total taxable value of land and additions on the property. | Land | Improvement |
|---|---|---|---|---|
| 2024 | $5,697 | $701,232 | $237,834 | $463,398 |
| 2023 | $5,697 | $732,067 | $248,292 | $483,775 |
| 2022 | $4,930 | $642,164 | $217,800 | $424,364 |
| 2021 | $4,757 | $530,714 | $180,000 | $350,714 |
| 2020 | $4,598 | $483,354 | $155,770 | $327,584 |
| 2019 | $4,114 | $451,594 | $145,650 | $305,944 |
| 2018 | $4,257 | $405,049 | $130,650 | $274,399 |
| 2017 | $3,702 | $358,391 | $115,600 | $242,791 |
| 2016 | $3,388 | $325,700 | $105,200 | $220,500 |
| 2015 | $3,572 | $310,300 | $100,000 | $210,300 |
| 2014 | -- | $316,581 | $98,040 | $218,541 |
| 2013 | -- | $303,084 | $95,000 | $208,084 |
Source: Public Records
Map
Nearby Homes
- 1314 Welling Rd
- 3713 Bristol St
- 3709 Bristol St
- 1379 Northwood Ct
- 3527 Sussex Dr
- 3010 E Sunset Dr
- 3606 Tree Farm Ct
- 3001 E Sunset Dr
- 1430 Welling Rd
- 3715 E Sunset Dr
- 3159 Chandler Pkwy
- 1368 Roma Rd
- 3155 Chandler Pkwy
- 3153 Chandler Pkwy
- 2809 E Sunset Dr
- 3785 Greenville Place
- 0 E Bakerview Rd Unit NWM2398341
- 4055 Springland Ct
- 3827 Keystone Way
- 3871 Cindy Ln
- 3751 N Heather Place
- 3735 N Heather Place
- 3772 Westhills Place
- 3727 N Heather Place
- 3759 N Heather Place
- 3760 Westhills Place
- 3734 N Heather Place
- 3742 N Heather Place
- 3784 Westhills Place
- 3758 Westhills Place
- 3726 N Heather Place
- 3758 Westhills Place
- 3719 N Heather Place
- 3773 N Heather Place
- 3758 N Heather Place
- 3718 N Heather Place
- 3780 N Heather Place
- 3746 Westhills Place
- 3766 N Heather Place