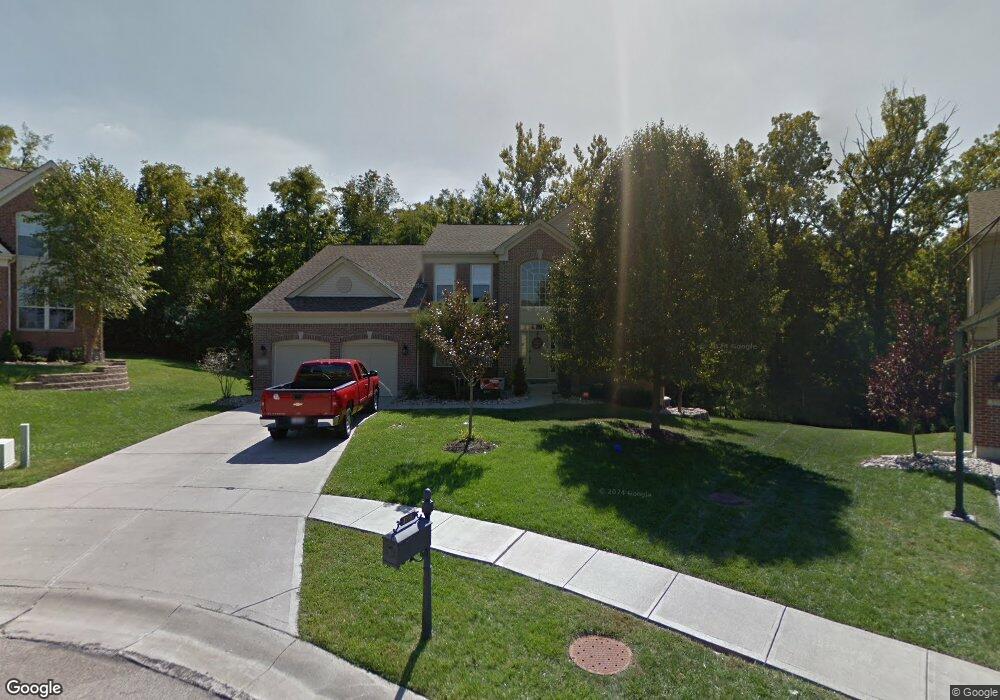
3745 Fallen Timbers Way Cleves, OH 45002
Estimated Value: $463,699 - $573,000
4
Beds
4
Baths
2,822
Sq Ft
$181/Sq Ft
Est. Value
About This Home
This home is located at 3745 Fallen Timbers Way, Cleves, OH 45002 and is currently estimated at $509,425, approximately $180 per square foot. 3745 Fallen Timbers Way is a home located in Hamilton County with nearby schools including Charles T. Young Elementary School, Taylor Middle School, and Taylor High School.
Ownership History
Date
Name
Owned For
Owner Type
Purchase Details
Closed on
Feb 1, 2011
Sold by
Mette Mark and Mette Andrea
Bought by
Rowland James E and Rowland Erin M
Current Estimated Value
Home Financials for this Owner
Home Financials are based on the most recent Mortgage that was taken out on this home.
Original Mortgage
$227,200
Outstanding Balance
$156,277
Interest Rate
4.89%
Mortgage Type
New Conventional
Estimated Equity
$353,148
Purchase Details
Closed on
Nov 24, 2004
Sold by
Fischer Single Family Homes Ii Llc
Bought by
Mette Mark and Mette Andrea
Home Financials for this Owner
Home Financials are based on the most recent Mortgage that was taken out on this home.
Original Mortgage
$244,000
Interest Rate
5.77%
Mortgage Type
Fannie Mae Freddie Mac
Purchase Details
Closed on
Aug 6, 2004
Sold by
Indian Walk Development Co
Bought by
Fischer Single Family Homes Ii Llc
Create a Home Valuation Report for This Property
The Home Valuation Report is an in-depth analysis detailing your home's value as well as a comparison with similar homes in the area
Home Values in the Area
Average Home Value in this Area
Purchase History
| Date | Buyer | Sale Price | Title Company |
|---|---|---|---|
| Rowland James E | -- | Attorney | |
| Mette Mark | -- | Homestead Title Agency Ltd | |
| Fischer Single Family Homes Ii Llc | -- | -- |
Source: Public Records
Mortgage History
| Date | Status | Borrower | Loan Amount |
|---|---|---|---|
| Open | Rowland James E | $227,200 | |
| Previous Owner | Mette Mark | $244,000 |
Source: Public Records
Tax History Compared to Growth
Tax History
| Year | Tax Paid | Tax Assessment Tax Assessment Total Assessment is a certain percentage of the fair market value that is determined by local assessors to be the total taxable value of land and additions on the property. | Land | Improvement |
|---|---|---|---|---|
| 2024 | $6,066 | $125,675 | $22,610 | $103,065 |
| 2023 | $5,863 | $125,675 | $22,610 | $103,065 |
| 2022 | $4,885 | $81,894 | $18,638 | $63,256 |
| 2021 | $4,750 | $81,894 | $18,638 | $63,256 |
| 2020 | $4,799 | $81,894 | $18,638 | $63,256 |
| 2019 | $5,028 | $79,510 | $18,095 | $61,415 |
| 2018 | $4,833 | $79,510 | $18,095 | $61,415 |
| 2017 | $4,533 | $79,510 | $18,095 | $61,415 |
| 2016 | $5,510 | $99,575 | $21,525 | $78,050 |
| 2015 | $5,568 | $99,575 | $21,525 | $78,050 |
| 2014 | $5,628 | $99,575 | $21,525 | $78,050 |
| 2013 | $5,509 | $99,575 | $21,525 | $78,050 |
Source: Public Records
Map
Nearby Homes
- 8735 Bridgetown Rd
- 3736 Bremen Pass
- 8708 Quietwood Ln
- 3889 Bear Ln
- Chattanooga Plan at Indian Walk
- Rockford Plan at Indian Walk
- Carlisle Plan at Indian Walk
- Miramar Plan at Indian Walk
- The Hoover Plan at Indian Walk
- Truman Plan at Indian Walk
- The Jefferson Plan at Indian Walk
- Somerset Plan at Indian Walk
- The Longwood Plan at Indian Walk
- Sanibel Plan at Indian Walk
- Birmingham Plan at Indian Walk
- The Washington Plan at Indian Walk
- 3894 Bremen Pass
- 8724 Deer Glen Ct
- 8720 Deer Glen Ct
- 525 E State Rd
- 3749 Fallen Timbers Way
- 3743 Fallen Timbers Way
- 3756 Fallen Timbers Way
- 3746 Fallen Timbers Way
- 3755 Fallen Timbers Way
- 3754 Fallen Timbers Way
- 3761 Fallen Timbers Way
- 3721 Indian Brave Trail
- 3725 Indian Brave Trail
- 3766 Fallen Timbers Way
- 3717 Indian Brave Trail
- 3733 Indian Brave Trail
- 3767 Fallen Timbers Way
- 3739 Indian Brave Trail
- 3778 Fallen Timbers Way
- 3773 Fallen Timbers Way
- 3757 Indian Brave Trail
- 3771 Indian Brave Trail
- 3757 Indian Mound Ave
- 3765 Indian Brave Trail