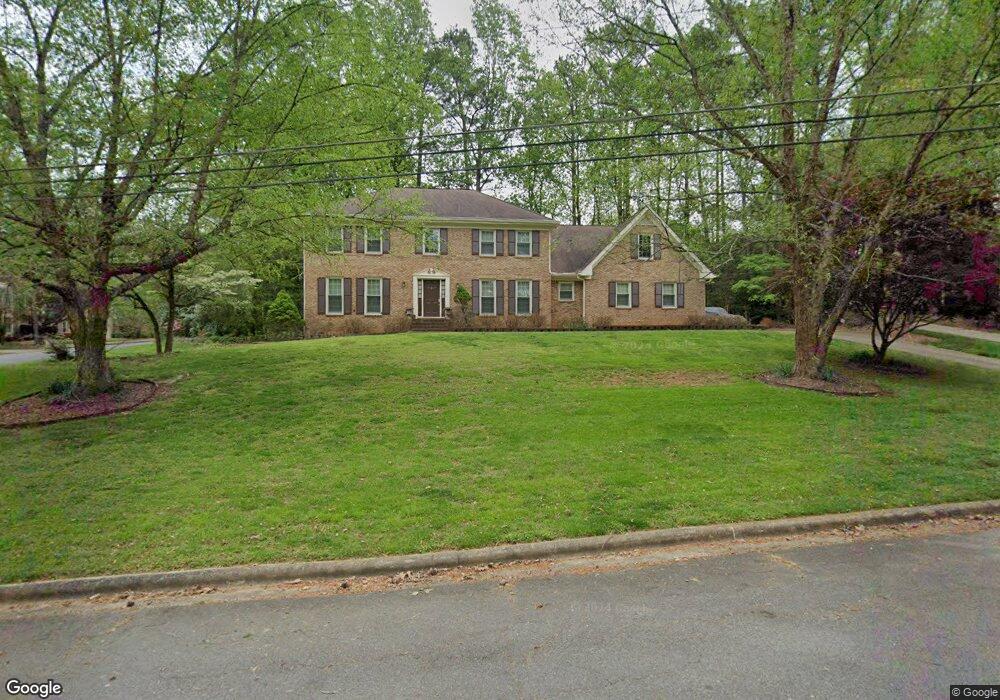
3745 Social Cir Norcross, GA 30092
Estimated Value: $585,000 - $735,000
4
Beds
4
Baths
2,410
Sq Ft
$272/Sq Ft
Est. Value
About This Home
This home is located at 3745 Social Cir, Norcross, GA 30092 and is currently estimated at $655,800, approximately $272 per square foot. 3745 Social Cir is a home located in Gwinnett County with nearby schools including Simpson Elementary School, Pinckneyville Middle School, and Norcross High School.
Ownership History
Date
Name
Owned For
Owner Type
Purchase Details
Closed on
Aug 5, 2024
Sold by
Ketmayura Christina Trust
Bought by
Sylvester Stuart
Current Estimated Value
Purchase Details
Closed on
Sep 23, 2015
Sold by
Ketmayura Dan
Bought by
Ketmayura Dan Ketmayura Chris and Of Dan Christina Ketma
Purchase Details
Closed on
Sep 14, 2009
Sold by
Martins Michael R and Martins Marion H
Bought by
Ketmayura Dan
Purchase Details
Closed on
Mar 27, 2009
Sold by
Martins Michael R
Bought by
Martins Michael R and Martins Marion H
Home Financials for this Owner
Home Financials are based on the most recent Mortgage that was taken out on this home.
Original Mortgage
$235,000
Interest Rate
4.86%
Mortgage Type
New Conventional
Purchase Details
Closed on
Dec 16, 2008
Sold by
Martins Abilio F
Bought by
Martins Michael R
Purchase Details
Closed on
Jan 17, 2002
Sold by
Martins Virginia V
Bought by
Martins Abilio F
Create a Home Valuation Report for This Property
The Home Valuation Report is an in-depth analysis detailing your home's value as well as a comparison with similar homes in the area
Home Values in the Area
Average Home Value in this Area
Purchase History
| Date | Buyer | Sale Price | Title Company |
|---|---|---|---|
| Sylvester Stuart | $560,000 | -- | |
| Ketmayura Dan Ketmayura Chris | -- | -- | |
| Ketmayura Dan | $325,000 | -- | |
| Martins Michael R | -- | -- | |
| Martins Michael R | -- | -- | |
| Martins Abilio F | -- | -- |
Source: Public Records
Mortgage History
| Date | Status | Borrower | Loan Amount |
|---|---|---|---|
| Previous Owner | Martins Michael R | $235,000 |
Source: Public Records
Tax History Compared to Growth
Tax History
| Year | Tax Paid | Tax Assessment Tax Assessment Total Assessment is a certain percentage of the fair market value that is determined by local assessors to be the total taxable value of land and additions on the property. | Land | Improvement |
|---|---|---|---|---|
| 2025 | -- | $264,320 | $50,160 | $214,160 |
| 2024 | $7,024 | $235,720 | $44,000 | $191,720 |
| 2023 | $7,024 | $235,720 | $44,000 | $191,720 |
| 2022 | $6,506 | $210,120 | $36,000 | $174,120 |
| 2021 | $5,887 | $174,600 | $35,520 | $139,080 |
| 2020 | $5,925 | $174,600 | $35,520 | $139,080 |
| 2019 | $5,338 | $156,320 | $30,000 | $126,320 |
| 2018 | $5,356 | $156,320 | $30,000 | $126,320 |
| 2016 | $4,757 | $135,680 | $24,000 | $111,680 |
| 2015 | $4,815 | $135,680 | $24,000 | $111,680 |
| 2014 | -- | $135,680 | $24,000 | $111,680 |
Source: Public Records
Map
Nearby Homes
- 5649 Whitesburg Ct
- 5786 Broxton Cir
- 4102 Ailey Ct
- ASBURY Plan at Overlook at Peachtree Corners
- RUTHERFORD II Plan at Overlook at Peachtree Corners
- 3723 Orchard St
- 3962 Gunnin Rd
- 3370 Oak Harbor Dr
- 4570 Waterside Pkwy
- 4053 Spalding Hollow NW
- 6027 Peachmont Terrace
- 3553 Corners Way
- 3922 Glen Meadow Dr
- 5885 Match Point
- 3630 Bridge Mill Ct Unit 2
- 507 Peachtree Forest Terrace
- 3910 Spalding Bluff Dr
- 4944 Sealy Cir
- 4965 Sealy Cir
- 3618 Allenhurst Dr
- 3744 High Shoals Dr
- 3609 Allenhurst Dr Unit 3
- 3599 Allenhurst Dr
- 3817 Social Cir
- 3619 Allenhurst Dr
- 3638 Allenhurst Dr Unit 3
- 3589 Allenhurst Dr Unit 2
- 3734 High Shoals Dr
- 3816 Social Cir
- 3629 Allenhurst Dr Unit 3
- 3807 Social Cir
- 3648 Allenhurst Dr
- 3794 High Shoals Dr
- 3834 High Shoals Dr
- 3824 High Shoals Dr Unit 2
- 3725 High Shoals Dr Unit 2
- 3814 High Shoals Dr Unit 2
- 5677 Mount Berry Ln
- 5691 Spur Cir