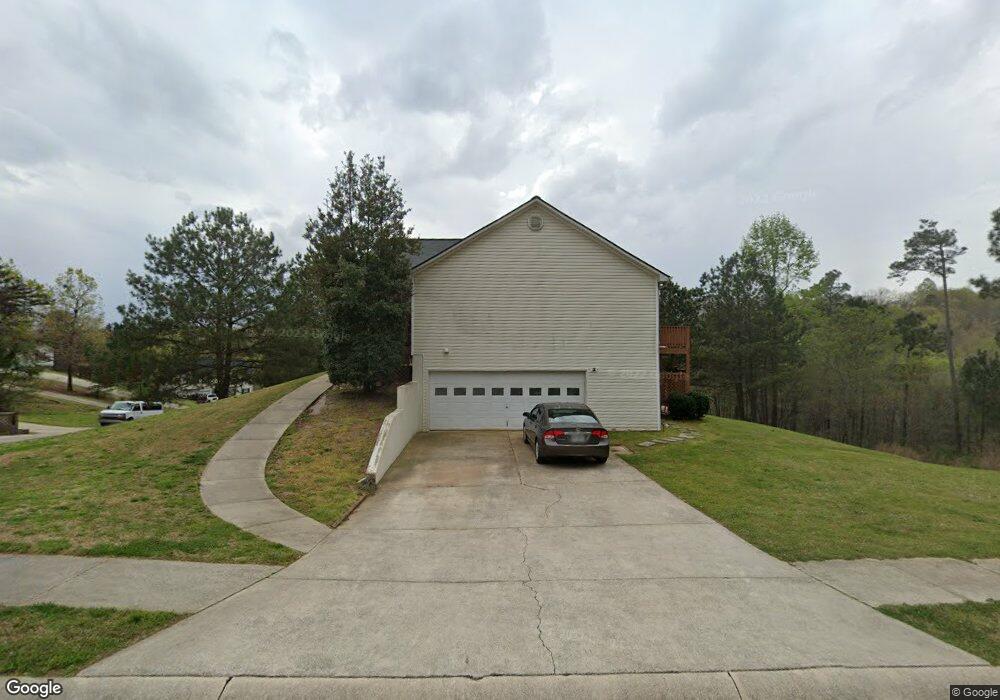
3745 Twin Creek Ct Flowery Branch, GA 30542
Estimated Value: $311,000 - $340,000
3
Beds
2
Baths
1,368
Sq Ft
$238/Sq Ft
Est. Value
About This Home
This home is located at 3745 Twin Creek Ct, Flowery Branch, GA 30542 and is currently estimated at $325,898, approximately $238 per square foot. 3745 Twin Creek Ct is a home located in Hall County with nearby schools including Martin Elementary School, Southwest Middle School, and South Hall Middle School.
Ownership History
Date
Name
Owned For
Owner Type
Purchase Details
Closed on
Sep 19, 2023
Sold by
Lowe Anthony C
Bought by
Dp Enterprises Llc
Current Estimated Value
Purchase Details
Closed on
Oct 1, 2004
Sold by
Hagler Frances K
Bought by
Lowe Anthony C
Home Financials for this Owner
Home Financials are based on the most recent Mortgage that was taken out on this home.
Original Mortgage
$116,000
Interest Rate
5.73%
Mortgage Type
New Conventional
Purchase Details
Closed on
May 16, 2003
Sold by
Lanman Homes Inc
Bought by
Hagler Frances K K
Home Financials for this Owner
Home Financials are based on the most recent Mortgage that was taken out on this home.
Original Mortgage
$114,800
Interest Rate
4%
Mortgage Type
New Conventional
Purchase Details
Closed on
Nov 15, 2002
Sold by
Ord Development Llc
Bought by
Lanman Homes Inc
Create a Home Valuation Report for This Property
The Home Valuation Report is an in-depth analysis detailing your home's value as well as a comparison with similar homes in the area
Home Values in the Area
Average Home Value in this Area
Purchase History
| Date | Buyer | Sale Price | Title Company |
|---|---|---|---|
| Dp Enterprises Llc | -- | -- | |
| Lowe Anthony C | $145,000 | -- | |
| Hagler Frances K | -- | -- | |
| Hagler Frances K K | $143,500 | -- | |
| Hagler William W | -- | -- | |
| Lanman Homes Inc | $27,000 | -- |
Source: Public Records
Mortgage History
| Date | Status | Borrower | Loan Amount |
|---|---|---|---|
| Previous Owner | Hagler Frances K | $116,000 | |
| Previous Owner | Hagler William W | $114,800 |
Source: Public Records
Tax History Compared to Growth
Tax History
| Year | Tax Paid | Tax Assessment Tax Assessment Total Assessment is a certain percentage of the fair market value that is determined by local assessors to be the total taxable value of land and additions on the property. | Land | Improvement |
|---|---|---|---|---|
| 2024 | $2,728 | $102,200 | $10,920 | $91,280 |
| 2023 | $2,578 | $96,440 | $10,920 | $85,520 |
| 2022 | $1,802 | $66,280 | $10,920 | $55,360 |
| 2021 | $1,814 | $61,680 | $10,920 | $50,760 |
| 2020 | $1,797 | $59,320 | $10,920 | $48,400 |
| 2019 | $1,714 | $56,000 | $10,920 | $45,080 |
| 2018 | $1,710 | $53,920 | $10,920 | $43,000 |
| 2017 | $1,694 | $53,920 | $10,920 | $43,000 |
| 2016 | $1,658 | $53,920 | $10,920 | $43,000 |
| 2015 | $1,669 | $53,920 | $10,920 | $43,000 |
| 2014 | $1,669 | $53,920 | $10,920 | $43,000 |
Source: Public Records
Map
Nearby Homes
- 4020 Parks Rd
- 4086 Parks Rd
- 4021 Laurant Path
- 4013 Laurant Path
- Wakehurst Plan at Falls Creek
- 3935 Alderstone Dr
- Sheridan Plan at Falls Creek
- Avera Plan at Falls Creek
- Atwood Plan at Falls Creek
- Trenton Plan at Falls Creek
- Prescott Plan at Falls Creek
- Ingram Plan at Falls Creek
- Fairfield Plan at Falls Creek
- Denton Plan at Falls Creek
- Edison Plan at Falls Creek
- 4054 Alderstone Dr
- 4050 Alderstone Dr
- 4042 Alderstone Dr
- 3617 Winder Hwy
- 4003 Warren Rd
- 3750 Fern Creek Dr
- 3743 Fern Creek Dr
- 3754 Fern Creek Dr
- 3739 Fern Creek Dr
- 3747 Fern Creek Dr
- 3752 Twin Creek Ct
- 3735 Fern Creek Dr
- 3748 Twin Creek Ct
- 3734 Fern Creek Dr
- 3731 Fern Creek Dr
- 3753 Twin Creek Ct
- 3759 Fern Creek Dr
- 3755 Fern Creek Dr
- 3751 Fern Creek Dr
- 3727 Fern Creek Dr
- 3726 Fern Creek Dr
- 0 Fern Creek Dr Unit 7240549
- 0 Fern Creek Dr Unit 3189686
- 3723 Fern Creek Dr
- 3722 Fern Creek Dr