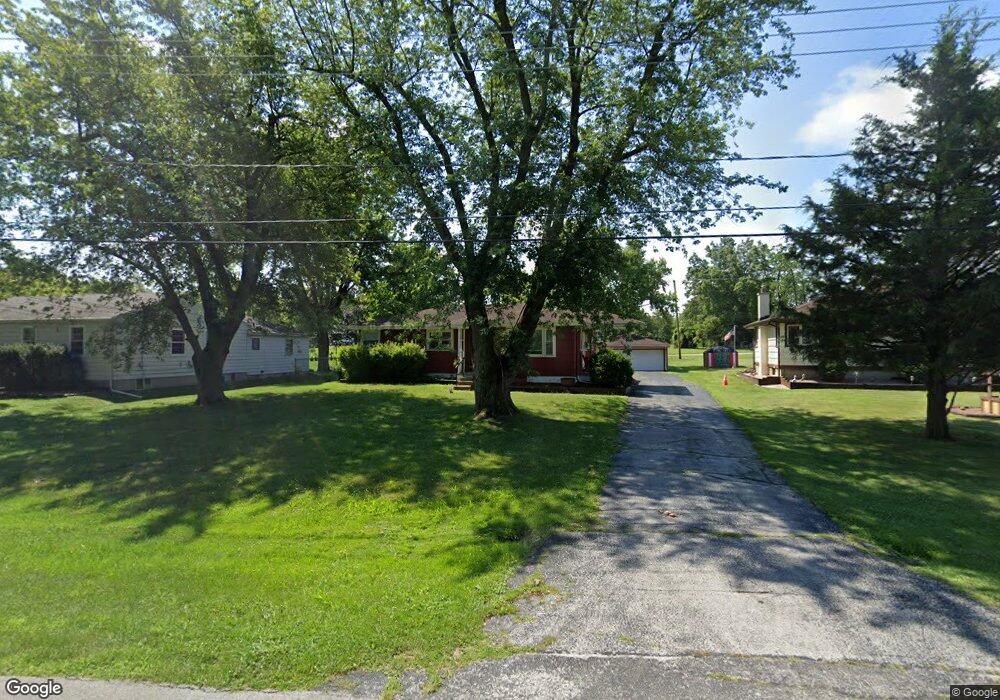
3745 W 162nd Place Markham, IL 60428
Estimated Value: $131,000 - $175,810
3
Beds
1
Bath
1,197
Sq Ft
$132/Sq Ft
Est. Value
About This Home
This home is located at 3745 W 162nd Place, Markham, IL 60428 and is currently estimated at $157,703, approximately $131 per square foot. 3745 W 162nd Place is a home located in Cook County with nearby schools including Markham Park Elementary School, Prairie-Hills Junior High School, and Tinley Park High School.
Ownership History
Date
Name
Owned For
Owner Type
Purchase Details
Closed on
Mar 22, 2023
Sold by
Stanwich Mtg Loan Tr
Bought by
Pearson Chandra
Current Estimated Value
Purchase Details
Closed on
Nov 21, 2022
Sold by
Judicial Sales Corporation
Bought by
Stanwich Mortgage Loan Trust
Purchase Details
Closed on
Dec 30, 2004
Sold by
Culver Scott A and Culver Jacqueline M
Bought by
Felkamp Lawrence D and Felkamp Ronald W
Home Financials for this Owner
Home Financials are based on the most recent Mortgage that was taken out on this home.
Original Mortgage
$126,022
Interest Rate
5.82%
Mortgage Type
FHA
Purchase Details
Closed on
Jul 6, 1995
Sold by
Sisk Kenneth G and Sisk Lois M
Bought by
Culver Scott Allen and Culver Jacqueline Marie
Home Financials for this Owner
Home Financials are based on the most recent Mortgage that was taken out on this home.
Original Mortgage
$64,000
Interest Rate
7.9%
Create a Home Valuation Report for This Property
The Home Valuation Report is an in-depth analysis detailing your home's value as well as a comparison with similar homes in the area
Home Values in the Area
Average Home Value in this Area
Purchase History
| Date | Buyer | Sale Price | Title Company |
|---|---|---|---|
| Pearson Chandra | $80,000 | Saturn Title | |
| Stanwich Mortgage Loan Trust | -- | None Listed On Document | |
| Felkamp Lawrence D | $128,000 | -- | |
| Culver Scott Allen | $80,000 | -- |
Source: Public Records
Mortgage History
| Date | Status | Borrower | Loan Amount |
|---|---|---|---|
| Previous Owner | Felkamp Lawrence D | $126,022 | |
| Previous Owner | Culver Scott Allen | $64,000 |
Source: Public Records
Tax History
| Year | Tax Paid | Tax Assessment Tax Assessment Total Assessment is a certain percentage of the fair market value that is determined by local assessors to be the total taxable value of land and additions on the property. | Land | Improvement |
|---|---|---|---|---|
| 2025 | $6,174 | $14,000 | $3,996 | $10,004 |
| 2024 | $6,174 | $14,000 | $3,996 | $10,004 |
| 2023 | $2,506 | $14,000 | $3,996 | $10,004 |
| 2022 | $2,506 | $6,490 | $3,552 | $2,938 |
| 2021 | $2,500 | $6,489 | $3,552 | $2,937 |
| 2020 | $2,619 | $6,489 | $3,552 | $2,937 |
| 2019 | $3,419 | $8,064 | $3,108 | $4,956 |
| 2018 | $3,304 | $8,064 | $3,108 | $4,956 |
| 2017 | $3,168 | $8,064 | $3,108 | $4,956 |
| 2016 | $2,921 | $6,770 | $2,664 | $4,106 |
| 2015 | $2,614 | $6,770 | $2,664 | $4,106 |
| 2014 | $2,653 | $6,770 | $2,664 | $4,106 |
| 2013 | $3,226 | $8,242 | $2,664 | $5,578 |
Source: Public Records
Map
Nearby Homes
- 16037 Springfield Ave
- 16225 Clifton Park Ave
- 16215 Clifton Park Ave
- 3924 Sunset Ave
- 16202 Saint Louis Ave
- 16213 Saint Louis Ave
- 16325 Saint Louis Ave
- 16302 Trumbull Ave
- 16517 Plainview Dr
- 16030 Saint Louis Ave
- 16110 Homan Ave
- 16408 Turner Ave
- 15826 Central Park Ave
- 3315 W 161st St
- 16516 Turner Ave
- 16446 Spaulding Ave
- 16107 Spaulding Ave
- 15742 Central Park Ave
- 16431 Spaulding Ave
- 4230 Barry Ln
- 3753 W 162nd Place
- 3737 W 162nd Place
- 3759 W 162nd Place
- 3727 W 162nd Place
- 3744 W 162nd Place
- 3721 W 162nd Place
- 3752 W 162nd Place
- 3736 W 162nd Place
- 3715 W 162nd Place
- 3715 W 163rd St
- 16237 Springfield Ave
- 3726 W 162nd Place
- 16230 Springfield Ave
- 3720 W 162nd Place
- 3709 W 162nd Place
- 3709 W 163rd St
- 3714 W 162nd Place
- 16225 Springfield Ave
- 16222 Springfield Ave
- 3703 W 162nd Place
Your Personal Tour Guide
Ask me questions while you tour the home.