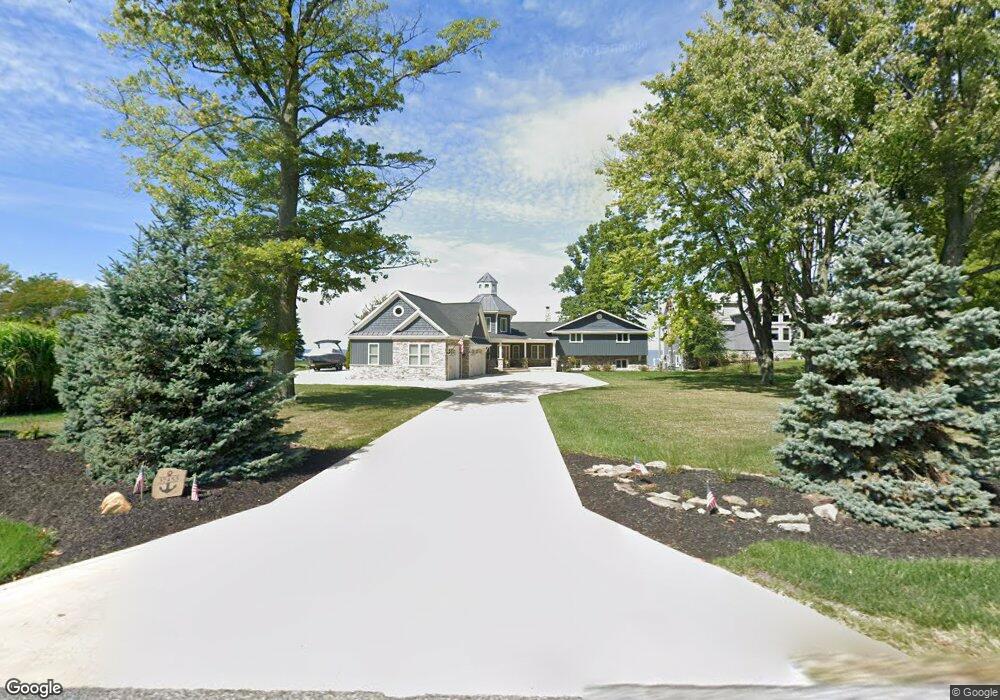
37455 Lake Shore Blvd Eastlake, OH 44095
Estimated Value: $510,000 - $840,398
5
Beds
4
Baths
2,132
Sq Ft
$318/Sq Ft
Est. Value
About This Home
This home is located at 37455 Lake Shore Blvd, Eastlake, OH 44095 and is currently estimated at $678,350, approximately $318 per square foot. 37455 Lake Shore Blvd is a home located in Lake County with nearby schools including Jefferson Elementary School, Eastlake Middle School, and North High School.
Ownership History
Date
Name
Owned For
Owner Type
Purchase Details
Closed on
May 31, 2007
Sold by
Jpmorgan Chase Bank
Bought by
Skandul Mario J and Skandul Sandra R
Current Estimated Value
Home Financials for this Owner
Home Financials are based on the most recent Mortgage that was taken out on this home.
Original Mortgage
$260,000
Outstanding Balance
$159,265
Interest Rate
6.21%
Mortgage Type
Purchase Money Mortgage
Estimated Equity
$519,085
Purchase Details
Closed on
Dec 1, 2006
Sold by
Kendig Kurt P
Bought by
Jpmorgan Chase Bank
Purchase Details
Closed on
Sep 7, 2001
Sold by
Verdi Mario P and Verdi Lynn M
Bought by
Kendig Kurt P and Kendig Debbie L
Home Financials for this Owner
Home Financials are based on the most recent Mortgage that was taken out on this home.
Original Mortgage
$284,500
Interest Rate
6.97%
Purchase Details
Closed on
Apr 2, 1985
Bought by
Verdi Mario P
Create a Home Valuation Report for This Property
The Home Valuation Report is an in-depth analysis detailing your home's value as well as a comparison with similar homes in the area
Home Values in the Area
Average Home Value in this Area
Purchase History
| Date | Buyer | Sale Price | Title Company |
|---|---|---|---|
| Skandul Mario J | $325,000 | Attorney | |
| Jpmorgan Chase Bank | $300,000 | None Available | |
| Kendig Kurt P | $391,250 | Midland Title Security Inc | |
| Verdi Mario P | -- | -- |
Source: Public Records
Mortgage History
| Date | Status | Borrower | Loan Amount |
|---|---|---|---|
| Open | Skandul Mario J | $260,000 | |
| Previous Owner | Kendig Kurt P | $284,500 | |
| Closed | Kendig Kurt P | $21,300 |
Source: Public Records
Tax History Compared to Growth
Tax History
| Year | Tax Paid | Tax Assessment Tax Assessment Total Assessment is a certain percentage of the fair market value that is determined by local assessors to be the total taxable value of land and additions on the property. | Land | Improvement |
|---|---|---|---|---|
| 2024 | -- | $305,810 | $87,560 | $218,250 |
| 2023 | $17,794 | $184,130 | $62,100 | $122,030 |
| 2022 | $11,726 | $184,130 | $62,100 | $122,030 |
| 2021 | $11,779 | $184,130 | $62,100 | $122,030 |
| 2020 | $11,520 | $160,110 | $54,000 | $106,110 |
| 2019 | $3,232 | $160,110 | $54,000 | $106,110 |
| 2018 | $6,612 | $120,690 | $44,690 | $76,000 |
| 2017 | $8,473 | $120,690 | $44,690 | $76,000 |
| 2016 | $7,913 | $120,690 | $44,690 | $76,000 |
| 2015 | $7,845 | $120,690 | $44,690 | $76,000 |
| 2014 | $7,440 | $120,690 | $44,690 | $76,000 |
| 2013 | $7,066 | $114,750 | $44,690 | $70,060 |
Source: Public Records
Map
Nearby Homes
- 147 Courtland Blvd
- 132 Shelton Blvd
- 37818 Lake Shore Blvd
- 158 E Overlook Dr
- 0 V L Lake Shore Blvd Unit 5070796
- 37750 Willow Dr
- 211 Plymouth Rd
- 1285 Leeward Ln Unit B
- 1245 Leeward Ln Unit A
- 307 Shelton Blvd
- 284 E Overlook Dr
- 211 W Overlook Dr
- 1298 Beech St
- 38256 Lake Shore Blvd
- 1068 Elmwood Dr
- 447 Saint Lawrence Blvd
- 38598 Granite Dr Unit 31
- 35940 Matoma Blvd
- 503 E Overlook Dr
- 1263 Lost Nation Rd Unit 5
- 37493 Lake Shore Blvd
- 37371 Lake Shore Blvd
- 37413 Lake Shore Blvd
- 37529 Lake Shore Blvd
- 37460 Lake Shore Blvd
- 37440 Lake Shore Blvd
- 37478 Lake Shore Blvd
- 37337 Lake Shore Blvd
- 37420 Lake Shore Blvd
- 37518 Lake Shore Blvd
- 37378 Lake Shore Blvd
- 37536 Lake Shore Blvd
- 37358 Lake Shore Blvd
- 115 Courtland Blvd
- 37297 Lake Shore Blvd
- 37338 Lake Shore Blvd
- 37599 Lake Shore Blvd
- 120 Traymore Blvd
- 115 Traymore Blvd
- 116 Courtland Blvd