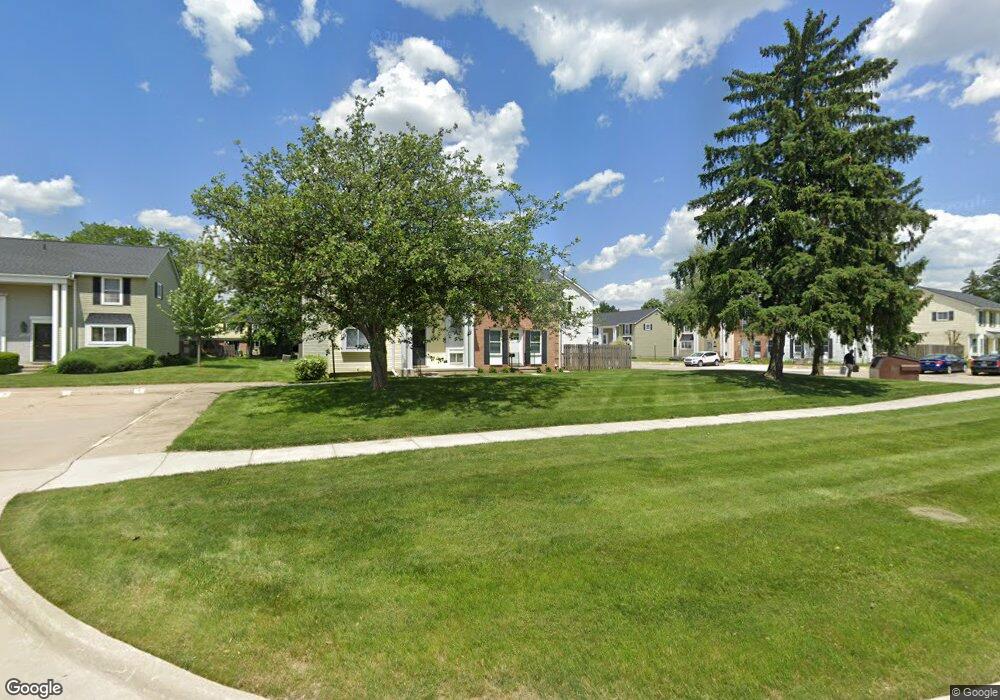
37477 Charter Oaks Blvd Unit 259 Clinton Township, MI 48036
Estimated Value: $129,000 - $170,021
3
Beds
2
Baths
1,245
Sq Ft
$127/Sq Ft
Est. Value
About This Home
This home is located at 37477 Charter Oaks Blvd Unit 259, Clinton Township, MI 48036 and is currently estimated at $158,255, approximately $127 per square foot. 37477 Charter Oaks Blvd Unit 259 is a home located in Macomb County with nearby schools including Ottawa Elementary School, Algonquin Middle School, and Chippewa Valley High School.
Ownership History
Date
Name
Owned For
Owner Type
Purchase Details
Closed on
Aug 11, 2025
Sold by
Houze Alisa
Bought by
Arnold Clinton M
Current Estimated Value
Purchase Details
Closed on
Jun 1, 2011
Sold by
Leslie Arnold Cynita Marie
Bought by
Houze Alisa C
Purchase Details
Closed on
Mar 14, 2011
Sold by
Secretary Of Housing & Urban Development
Bought by
Leslie Arnold Cynita Marie
Purchase Details
Closed on
Sep 16, 2010
Sold by
Bac Home Loans Servicing Lp
Bought by
The Secretary Of Housing & Urban Develop
Purchase Details
Closed on
Aug 6, 2010
Sold by
Robbins Denise
Bought by
Bac Home Loans Servicing Lp
Purchase Details
Closed on
Mar 12, 2010
Sold by
Robbins Denise
Bought by
Fox Chase Condominium Association
Purchase Details
Closed on
Apr 29, 2004
Sold by
Habkirk Donald I and Habkirk Sharon M
Bought by
Robbins Denise
Create a Home Valuation Report for This Property
The Home Valuation Report is an in-depth analysis detailing your home's value as well as a comparison with similar homes in the area
Home Values in the Area
Average Home Value in this Area
Purchase History
| Date | Buyer | Sale Price | Title Company |
|---|---|---|---|
| Arnold Clinton M | $500 | None Listed On Document | |
| Arnold Clinton M | $500 | None Listed On Document | |
| Houze Alisa C | $10,000 | None Available | |
| Leslie Arnold Cynita Marie | $35,000 | None Available | |
| The Secretary Of Housing & Urban Develop | -- | None Available | |
| Bac Home Loans Servicing Lp | $145,812 | None Available | |
| Fox Chase Condominium Association | $11,672 | None Available | |
| Robbins Denise | $119,900 | Metropolitan Title Company |
Source: Public Records
Tax History Compared to Growth
Tax History
| Year | Tax Paid | Tax Assessment Tax Assessment Total Assessment is a certain percentage of the fair market value that is determined by local assessors to be the total taxable value of land and additions on the property. | Land | Improvement |
|---|---|---|---|---|
| 2025 | $2,196 | $69,200 | $0 | $0 |
| 2024 | $1,583 | $66,100 | $0 | $0 |
| 2023 | $946 | $62,700 | $0 | $0 |
| 2022 | $1,433 | $60,300 | $0 | $0 |
| 2021 | $1,406 | $53,200 | $0 | $0 |
| 2020 | $903 | $48,800 | $0 | $0 |
| 2019 | $1,336 | $43,400 | $0 | $0 |
| 2018 | $1,320 | $39,500 | $0 | $0 |
| 2017 | $1,317 | $27,200 | $4,500 | $22,700 |
| 2016 | $1,318 | $27,200 | $0 | $0 |
| 2015 | -- | $27,300 | $0 | $0 |
| 2014 | -- | $25,700 | $0 | $0 |
| 2011 | -- | $35,800 | $0 | $35,800 |
Source: Public Records
Map
Nearby Homes
- 37439 Charter Oaks Blvd Unit 114
- 37619 Charter Oaks Blvd Unit 222
- 37682 Charter Oaks Blvd
- 37053 Brynford Dr
- 37236 Great Oaks Ct
- 37218 Charter Oaks Blvd
- 20463 Harmony Dr
- 19975 S Great Oaks Cir
- 20002 S Great Oaks Cir
- 37829 Pocahontas Dr
- 37743 Rosedale Dr
- 20543 Glenallen Dr
- 37850 Maple Cir E
- 37840 Culver Dr
- VL Moravian Dr
- 20706 Gaslight Dr
- 18917 Monica Dr
- 18908 Monica Dr
- 20810 Gaslight Dr
- 21404 Drexel St
- 37475 Charter Oaks Blvd Unit 39, 260
- 37469 Charter Oaks Blvd Unit 263
- 37471 Charter Oaks Blvd Unit 262
- 37473 Charter Oaks Blvd
- 37479 Charter Oaks Blvd
- 37481 Charter Oaks Blvd Unit 257
- 37483 Charter Oaks Blvd
- 37483 Charter Oaks Blvd Unit 39 256
- 37483 Charter Oaks Blvd Unit 256
- 37475 Charter Oaks Blvd Unit 260
- 37371 Charter Oaks Blvd Unit 490
- 37369 Charter Oaks Blvd Unit 489
- 37367 Charter Oaks Blvd
- 37365 Charter Oaks Blvd Unit 487
- 37363 Charter Oaks Blvd Unit 486
- 37361 Charter Oaks Blvd
- 37499 Charter Oaks Blvd Unit 270
- 37499 Charter Oaks Blvd Unit 40 270
- 37499 Charter Oaks Blvd
- 37497 Charter Oaks Blvd