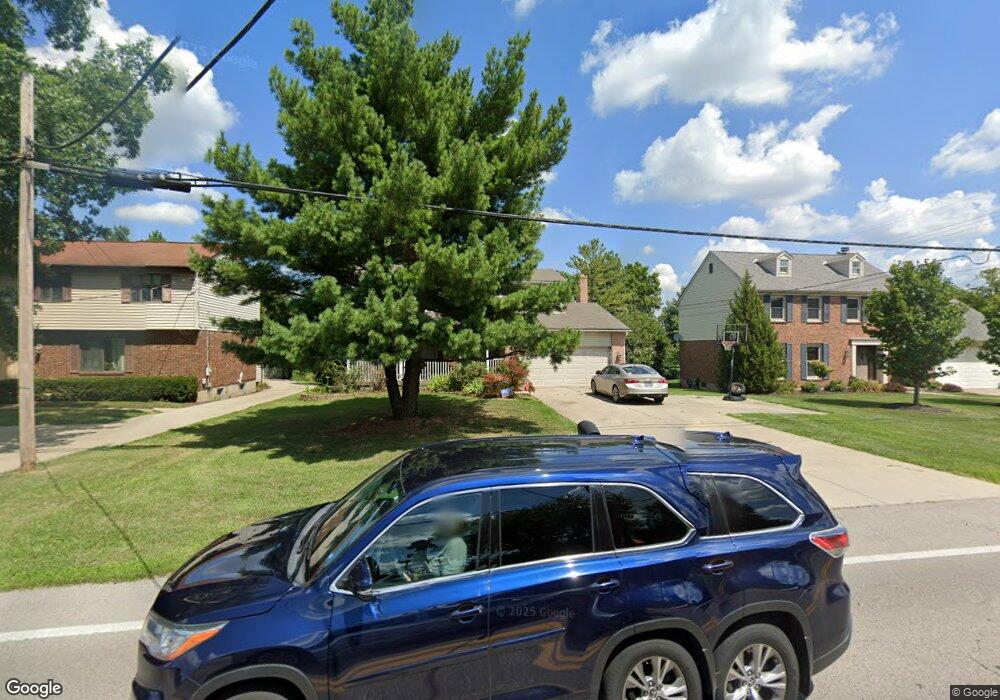
3748 W Fork Rd Cincinnati, OH 45247
West Monfort Heights NeighborhoodEstimated Value: $346,501 - $420,000
4
Beds
3
Baths
1,860
Sq Ft
$201/Sq Ft
Est. Value
About This Home
This home is located at 3748 W Fork Rd, Cincinnati, OH 45247 and is currently estimated at $373,125, approximately $200 per square foot. 3748 W Fork Rd is a home located in Hamilton County with nearby schools including Monfort Heights Elementary School, White Oak Middle School, and Colerain High School.
Ownership History
Date
Name
Owned For
Owner Type
Purchase Details
Closed on
Apr 25, 2019
Sold by
Robinson Steven J
Bought by
Jr 2 Llc
Current Estimated Value
Purchase Details
Closed on
Apr 14, 2017
Sold by
Hamilton County Sheriff
Bought by
Pentagon Federal Cu
Purchase Details
Closed on
Dec 3, 2006
Sold by
Hebenstreit Steven T
Bought by
Hebenstreit Garret T
Purchase Details
Closed on
Sep 8, 1998
Sold by
Swauger James R
Bought by
Hebenstreit Steven T
Purchase Details
Closed on
May 30, 1996
Sold by
Quinn Jerry L and Quinn Patricia L
Bought by
Swauger James R
Home Financials for this Owner
Home Financials are based on the most recent Mortgage that was taken out on this home.
Original Mortgage
$93,750
Interest Rate
7.99%
Create a Home Valuation Report for This Property
The Home Valuation Report is an in-depth analysis detailing your home's value as well as a comparison with similar homes in the area
Home Values in the Area
Average Home Value in this Area
Purchase History
| Date | Buyer | Sale Price | Title Company |
|---|---|---|---|
| Jr 2 Llc | -- | None Available | |
| Pentagon Federal Cu | $100,900 | -- | |
| Hebenstreit Garret T | -- | None Available | |
| Hebenstreit Steven T | $138,000 | Vintage Title Agency Inc | |
| Swauger James R | $125,000 | -- |
Source: Public Records
Mortgage History
| Date | Status | Borrower | Loan Amount |
|---|---|---|---|
| Previous Owner | Swauger James R | $93,750 |
Source: Public Records
Tax History
| Year | Tax Paid | Tax Assessment Tax Assessment Total Assessment is a certain percentage of the fair market value that is determined by local assessors to be the total taxable value of land and additions on the property. | Land | Improvement |
|---|---|---|---|---|
| 2025 | $4,719 | $84,833 | $14,350 | $70,483 |
| 2023 | $4,670 | $84,833 | $14,350 | $70,483 |
| 2022 | $4,208 | $62,598 | $13,976 | $48,622 |
| 2021 | $3,938 | $62,598 | $13,976 | $48,622 |
| 2020 | $3,889 | $62,598 | $13,976 | $48,622 |
| 2019 | $3,849 | $55,892 | $12,478 | $43,414 |
| 2018 | $3,440 | $55,892 | $12,478 | $43,414 |
| 2017 | $3,296 | $55,892 | $12,478 | $43,414 |
| 2016 | $3,225 | $53,288 | $12,352 | $40,936 |
| 2015 | $3,072 | $53,288 | $12,352 | $40,936 |
| 2014 | $3,077 | $53,288 | $12,352 | $40,936 |
| 2013 | $2,908 | $53,827 | $12,478 | $41,349 |
Source: Public Records
Map
Nearby Homes
- 5491 Asbury Lake Dr
- 5440 Asbury Lake Dr
- 4044 W Fork Rd
- 5165 N Bend Crossing
- 5320 Meadow Walk Ln
- 3899 Ridgedale Dr
- 4252 Runningfawn Dr
- 3505 W Fork Rd
- 5763 Cheviot Rd
- 4491 W Fork Rd
- 5765 Cheviot Rd Unit 52D
- 5769 Cheviot Rd
- 5425 Philloret Dr
- 3775 Boomer Rd
- 5725 Lauderdale Dr
- 4201 Boomer Rd
- 5893 Fawnridge Ct
- 5015 Nighthawk Dr
- 5165 Rowan Dr
- 4575 Boomer Rd
- 3752 W Fork Rd
- 3736 W Fork Rd
- 3756 W Fork Rd
- 3728 W Fork Rd
- 3764 W Fork Rd
- 5451 Asbury Lake Dr
- 5451 Asbury Lake Dr
- 5451 Asbury Lake Dr
- 5451 Asbury Lake Dr
- 5451 Asbury Lake Dr
- 5451 Asbury Lake Dr
- 5451 Asbury Lake Dr Unit 67
- 5451 Asbury Lake Dr Unit 70
- 3718 W Fork Rd
- 3772 W Fork Rd
- 5441 Asbury Lake Dr Unit 4
- 5443 Asbury Lake Dr Unit 6
- 5443 Asbury Lake Dr Unit 5
- 5443 Asbury Lake Dr
- 5443 Asbury Lake Dr