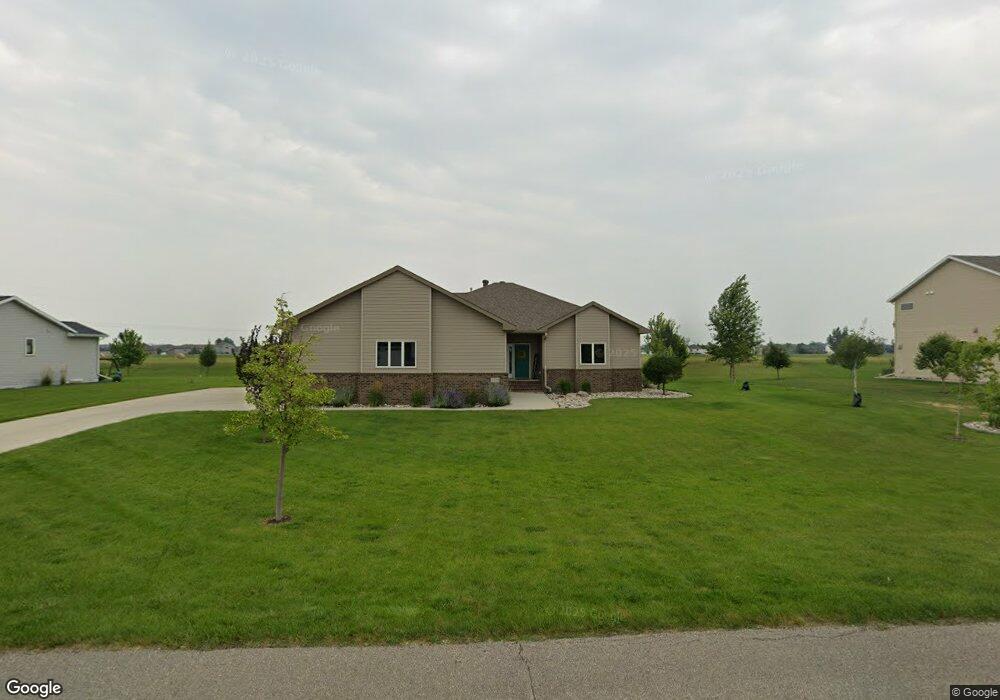
3749 14th St W West Fargo, ND 58078
Eagle Run NeighborhoodEstimated Value: $632,511 - $667,000
5
Beds
3
Baths
1,674
Sq Ft
$388/Sq Ft
Est. Value
About This Home
This home is located at 3749 14th St W, West Fargo, ND 58078 and is currently estimated at $649,756, approximately $388 per square foot. 3749 14th St W is a home located in Cass County with nearby schools including Aurora Elementary School, Liberty Middle School, and West Fargo Sheyenne High School.
Ownership History
Date
Name
Owned For
Owner Type
Purchase Details
Closed on
Oct 16, 2015
Sold by
Marksmen Contractors Llc
Bought by
Christians Eric D and Christians Jennie A
Current Estimated Value
Home Financials for this Owner
Home Financials are based on the most recent Mortgage that was taken out on this home.
Original Mortgage
$316,800
Outstanding Balance
$249,171
Interest Rate
3.87%
Mortgage Type
New Conventional
Estimated Equity
$400,585
Purchase Details
Closed on
Oct 28, 2013
Sold by
Tompkins Charles and Tompkins Linda
Bought by
Chulinda Investments Llp
Purchase Details
Closed on
Aug 30, 2013
Sold by
Chulinda Investments Llp
Bought by
Tompkins Matthew and Tompkins Mathew
Purchase Details
Closed on
Aug 3, 2013
Sold by
Tompkins Matthew and Tompkins Rebekah
Bought by
Mnarksmen Contractors Llc
Create a Home Valuation Report for This Property
The Home Valuation Report is an in-depth analysis detailing your home's value as well as a comparison with similar homes in the area
Home Values in the Area
Average Home Value in this Area
Purchase History
| Date | Buyer | Sale Price | Title Company |
|---|---|---|---|
| Christians Eric D | -- | None Available | |
| Chulinda Investments Llp | $60,000 | None Available | |
| Tompkins Matthew | $60,000 | None Available | |
| Mnarksmen Contractors Llc | $60,000 | None Available |
Source: Public Records
Mortgage History
| Date | Status | Borrower | Loan Amount |
|---|---|---|---|
| Open | Christians Eric D | $316,800 |
Source: Public Records
Tax History Compared to Growth
Tax History
| Year | Tax Paid | Tax Assessment Tax Assessment Total Assessment is a certain percentage of the fair market value that is determined by local assessors to be the total taxable value of land and additions on the property. | Land | Improvement |
|---|---|---|---|---|
| 2024 | $7,212 | $273,600 | $40,600 | $233,000 |
| 2023 | $7,326 | $258,200 | $40,600 | $217,600 |
| 2022 | $6,962 | $239,200 | $40,600 | $198,600 |
| 2021 | $6,616 | $223,100 | $30,450 | $192,650 |
| 2020 | $6,256 | $214,300 | $30,450 | $183,850 |
| 2019 | $6,084 | $207,400 | $30,450 | $176,950 |
| 2018 | $5,686 | $203,350 | $30,450 | $172,900 |
| 2017 | $3,503 | $130,100 | $30,450 | $99,650 |
| 2016 | $2,988 | $126,150 | $30,450 | $95,700 |
| 2015 | $4,059 | $161,250 | $20,850 | $140,400 |
| 2014 | $4,949 | $45,800 | $20,850 | $24,950 |
| 2013 | $4,265 | $14,600 | $14,600 | $0 |
Source: Public Records
Map
Nearby Homes
- 1040 39th Ave W
- 1156 42nd Ave W Unit A
- 1236 S Beach Way
- 3662 N Sedona Ct
- 909 38 1 2 Ave W
- 1054 42nd Ave W
- 1168 43rd Ave W
- 1381 Westport Beach Way
- 945 31st Ave W
- 4509 11th St W
- 4507 Newport Ln
- 922 31st Ave W
- 1015 29th Ave W
- 4534 Westport Pkwy
- 939 Eaglewood Ave
- 4717 11th St W
- 4757 11th St W
- 1097 Hickory Ln
- 2734 12th St W
- 1089 Hickory Ln