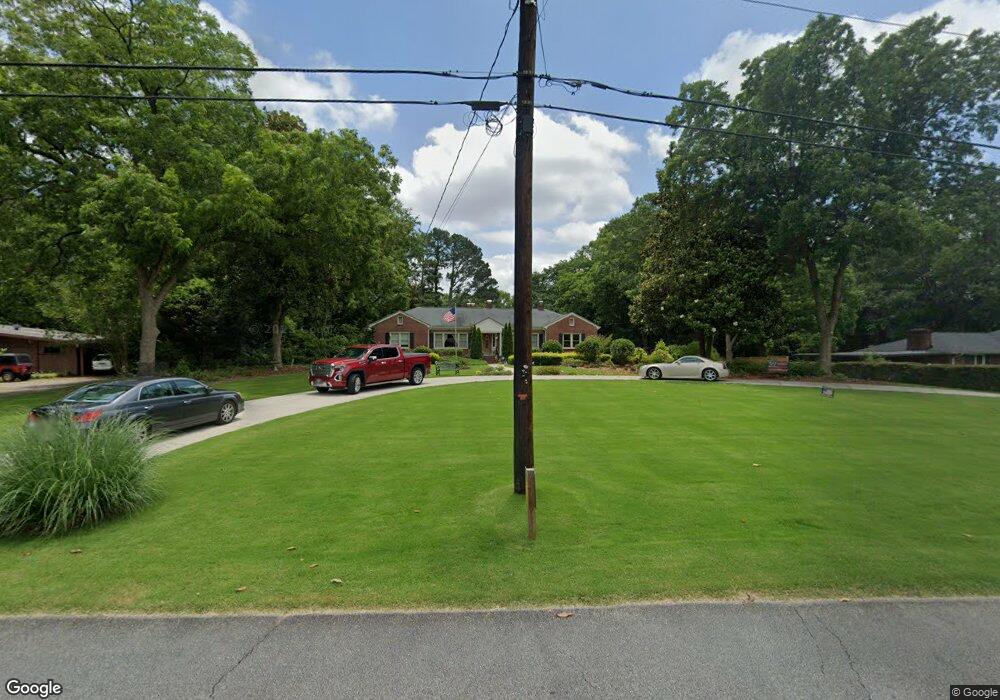
375 3rd Ave Winder, GA 30680
Estimated Value: $364,000 - $410,562
3
Beds
3
Baths
2,780
Sq Ft
$143/Sq Ft
Est. Value
About This Home
This home is located at 375 3rd Ave, Winder, GA 30680 and is currently estimated at $397,641, approximately $143 per square foot. 375 3rd Ave is a home located in Barrow County with nearby schools including County Line Elementary School, Russell Middle School, and Winder-Barrow High School.
Ownership History
Date
Name
Owned For
Owner Type
Purchase Details
Closed on
Jun 4, 2020
Sold by
Townsend James W
Bought by
James And Darlene Townsend Liv Tr
Current Estimated Value
Purchase Details
Closed on
Aug 7, 2015
Sold by
Townsend James W
Bought by
Townsend Darlene Lamelle
Purchase Details
Closed on
Oct 5, 2011
Sold by
Townsend James W
Bought by
Walker Darlene L
Purchase Details
Closed on
Mar 21, 2011
Sold by
Sanders Alice E B
Bought by
Townsend James W
Home Financials for this Owner
Home Financials are based on the most recent Mortgage that was taken out on this home.
Original Mortgage
$100,000
Interest Rate
4.99%
Mortgage Type
Trade
Purchase Details
Closed on
May 30, 1996
Sold by
Sanders Charles M
Bought by
Sanders Alice Emily B
Purchase Details
Closed on
Apr 21, 1950
Bought by
Sanders Charles M
Create a Home Valuation Report for This Property
The Home Valuation Report is an in-depth analysis detailing your home's value as well as a comparison with similar homes in the area
Home Values in the Area
Average Home Value in this Area
Purchase History
| Date | Buyer | Sale Price | Title Company |
|---|---|---|---|
| James And Darlene Townsend Liv Tr | -- | -- | |
| Townsend Darlene Lamelle | -- | -- | |
| Walker Darlene L | -- | -- | |
| Townsend James W | $128,000 | -- | |
| Sanders Alice Emily B | -- | -- | |
| Sanders Charles M | -- | -- |
Source: Public Records
Mortgage History
| Date | Status | Borrower | Loan Amount |
|---|---|---|---|
| Previous Owner | Townsend James W | $100,000 |
Source: Public Records
Tax History
| Year | Tax Paid | Tax Assessment Tax Assessment Total Assessment is a certain percentage of the fair market value that is determined by local assessors to be the total taxable value of land and additions on the property. | Land | Improvement |
|---|---|---|---|---|
| 2025 | $3,871 | $144,163 | $18,800 | $125,363 |
| 2024 | $3,891 | $141,370 | $18,800 | $122,570 |
| 2023 | $3,403 | $141,370 | $18,800 | $122,570 |
| 2022 | $3,561 | $108,761 | $18,800 | $89,961 |
| 2021 | $3,480 | $101,961 | $12,000 | $89,961 |
| 2020 | $2,959 | $90,241 | $12,000 | $78,241 |
| 2019 | $2,624 | $78,874 | $10,000 | $68,874 |
| 2018 | $2,614 | $78,874 | $10,000 | $68,874 |
| 2017 | $2,275 | $76,261 | $8,000 | $68,261 |
| 2016 | $2,318 | $73,254 | $8,000 | $65,254 |
| 2015 | $2,321 | $73,254 | $8,000 | $65,254 |
| 2014 | $1,743 | $56,424 | $5,488 | $50,936 |
| 2013 | -- | $53,597 | $5,488 | $48,109 |
Source: Public Records
Map
Nearby Homes
Your Personal Tour Guide
Ask me questions while you tour the home.