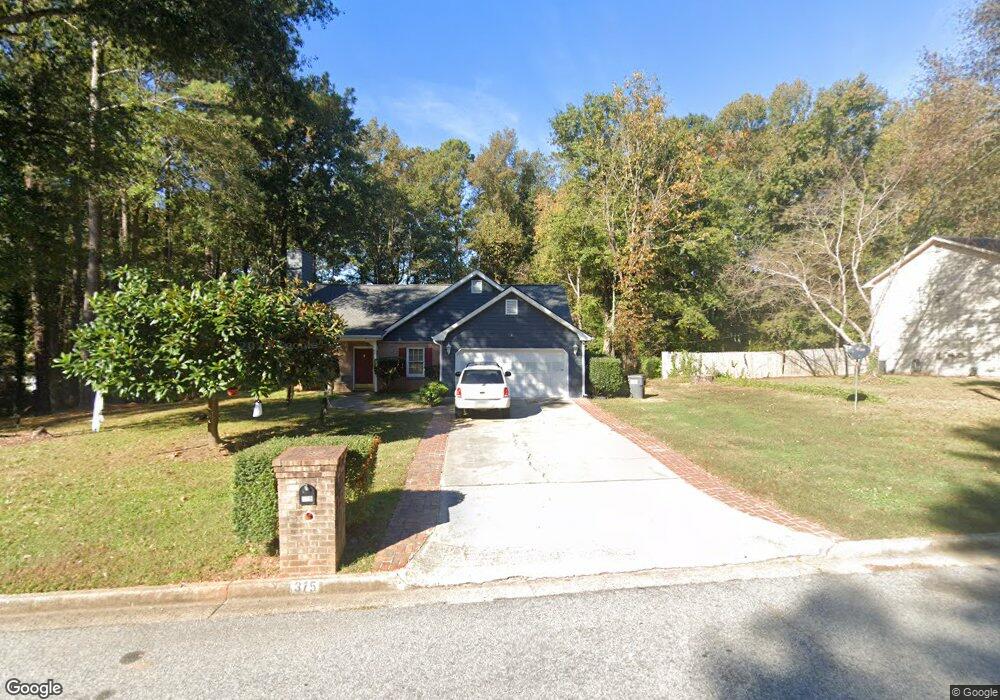
375 Christian Woods Dr SE Conyers, GA 30013
Estimated Value: $243,000 - $262,000
3
Beds
2
Baths
1,411
Sq Ft
$178/Sq Ft
Est. Value
About This Home
This home is located at 375 Christian Woods Dr SE, Conyers, GA 30013 and is currently estimated at $250,662, approximately $177 per square foot. 375 Christian Woods Dr SE is a home located in Newton County with nearby schools including Oak Hill Elementary School, Veterans Memorial Middle School, and Alcovy High School.
Ownership History
Date
Name
Owned For
Owner Type
Purchase Details
Closed on
May 4, 2018
Sold by
Jason R Erson
Bought by
Baker Darryl
Current Estimated Value
Home Financials for this Owner
Home Financials are based on the most recent Mortgage that was taken out on this home.
Original Mortgage
$116,707
Outstanding Balance
$100,834
Interest Rate
4.55%
Estimated Equity
$149,828
Purchase Details
Closed on
Jul 3, 2017
Sold by
Jp Morgan Chase Bk Na
Bought by
Anderson Jason Robert
Purchase Details
Closed on
Feb 7, 2017
Sold by
Phillips Jimmy
Bought by
Jpmorgan Chase Bank National A
Purchase Details
Closed on
Jul 24, 2008
Sold by
Phillips Lillie B
Bought by
Phillips Lillie B
Purchase Details
Closed on
Feb 1, 2008
Sold by
Moseley Keith E
Bought by
Phillips Jimmy L and Phillips Lillie B
Home Financials for this Owner
Home Financials are based on the most recent Mortgage that was taken out on this home.
Original Mortgage
$121,800
Interest Rate
6.12%
Mortgage Type
FHA
Create a Home Valuation Report for This Property
The Home Valuation Report is an in-depth analysis detailing your home's value as well as a comparison with similar homes in the area
Home Values in the Area
Average Home Value in this Area
Purchase History
| Date | Buyer | Sale Price | Title Company |
|---|---|---|---|
| Baker Darryl | -- | -- | |
| Anderson Jason Robert | $95,000 | -- | |
| Jpmorgan Chase Bank National A | $81,620 | -- | |
| Phillips Lillie B | -- | -- | |
| Phillips Jimmy L | $123,800 | -- |
Source: Public Records
Mortgage History
| Date | Status | Borrower | Loan Amount |
|---|---|---|---|
| Open | Baker Darryl | $116,707 | |
| Closed | Baker Darryl | -- | |
| Previous Owner | Phillips Jimmy L | $121,800 |
Source: Public Records
Tax History Compared to Growth
Tax History
| Year | Tax Paid | Tax Assessment Tax Assessment Total Assessment is a certain percentage of the fair market value that is determined by local assessors to be the total taxable value of land and additions on the property. | Land | Improvement |
|---|---|---|---|---|
| 2024 | $2,335 | $96,040 | $16,000 | $80,040 |
| 2023 | $2,086 | $80,760 | $7,400 | $73,360 |
| 2022 | $2,015 | $66,440 | $7,400 | $59,040 |
| 2021 | $1,596 | $56,520 | $7,400 | $49,120 |
| 2020 | $1,533 | $49,520 | $7,400 | $42,120 |
| 2019 | $1,406 | $45,120 | $7,400 | $37,720 |
| 2018 | $1,305 | $40,600 | $6,000 | $34,600 |
| 2017 | $1,354 | $39,440 | $6,000 | $33,440 |
| 2016 | $1,096 | $31,920 | $5,600 | $26,320 |
| 2015 | $976 | $28,440 | $5,600 | $22,840 |
| 2014 | $973 | $28,440 | $0 | $0 |
Source: Public Records
Map
Nearby Homes
- 330 Christian Woods Dr SE
- 65 King James Ct SE
- 4260 Brandy Ln SE
- 1296 Carman Ct SE
- 1789 Brandy Dr SE
- 1120 Kinnett Rd
- 1107 Brookfield Dr SE
- 1104 Brookfield Dr SE
- 1790 Brandy Woods Trail SE
- 4195 Stephanie Cir SE
- 1828 Brandy Woods Dr SE
- 1020 Thornwood Cir
- 13935 Brown Bridge Rd
- 1580 Christian Cir SE
- 926 Bell Rd SE
- 4217 SE Lindsey Way
- 4824 Georgia 20
- 385 Christian Woods Dr SE
- 365 Christian Woods Dr SE
- 0 Christian Woods Dr Unit 8692098
- 0 Christian Woods Dr Unit 7256311
- 0 Christian Woods Dr Unit 8891038
- 0 Christian Woods Dr Unit 3194122
- 0 Christian Woods Dr Unit 7085906
- 0 Christian Woods Dr Unit 7243561
- 0 Christian Woods Dr Unit 7324890
- 0 Christian Woods Dr Unit 7641504
- 0 Christian Woods Dr Unit 8093779
- 0 Christian Woods Dr Unit 8236651
- 0 Christian Woods Dr Unit 8486168
- 0 Christian Woods Dr Unit 45A
- 225 Christian Woods Dr SE
- 395 Christian Woods Dr SE
- 215 Christian Woods Dr SE
- 235 Christian Woods Dr SE
- 360 Christian Woods Dr
- 370 Christian Woods Dr SE