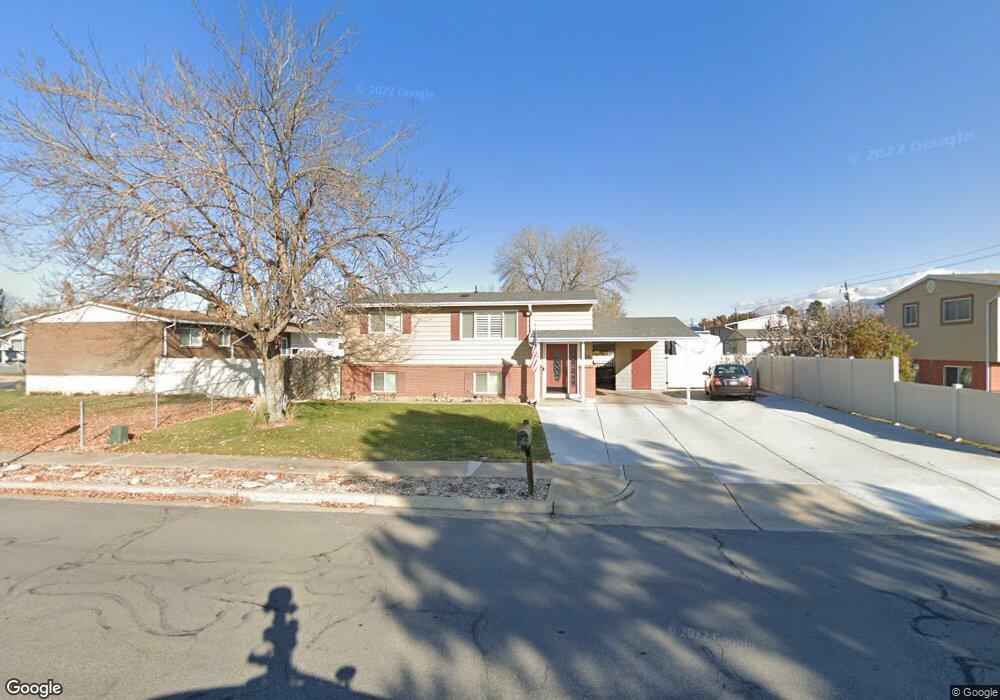
375 E 1150 N Layton, UT 84041
Estimated Value: $407,000 - $442,000
4
Beds
2
Baths
864
Sq Ft
$492/Sq Ft
Est. Value
About This Home
This home is located at 375 E 1150 N, Layton, UT 84041 and is currently estimated at $424,762, approximately $491 per square foot. 375 E 1150 N is a home located in Davis County with nearby schools including King Elementary School, Central Davis Junior High School, and Northridge High School.
Ownership History
Date
Name
Owned For
Owner Type
Purchase Details
Closed on
May 7, 2024
Sold by
Backus Jeffery W
Bought by
Backus Jeffery W and Backus Roxanne L
Current Estimated Value
Home Financials for this Owner
Home Financials are based on the most recent Mortgage that was taken out on this home.
Original Mortgage
$314,407
Outstanding Balance
$309,628
Interest Rate
6.79%
Mortgage Type
FHA
Estimated Equity
$115,134
Purchase Details
Closed on
May 30, 2006
Sold by
Backus Gregory Arthur
Bought by
Backus Jeffery W
Home Financials for this Owner
Home Financials are based on the most recent Mortgage that was taken out on this home.
Original Mortgage
$100,000
Interest Rate
6.52%
Mortgage Type
Fannie Mae Freddie Mac
Create a Home Valuation Report for This Property
The Home Valuation Report is an in-depth analysis detailing your home's value as well as a comparison with similar homes in the area
Home Values in the Area
Average Home Value in this Area
Purchase History
| Date | Buyer | Sale Price | Title Company |
|---|---|---|---|
| Backus Jeffery W | -- | Mortgage Connect | |
| Backus Jeffery W | -- | Mortgage Connect | |
| Backus Jeffery W | -- | Equity Title Ins Agency Inc |
Source: Public Records
Mortgage History
| Date | Status | Borrower | Loan Amount |
|---|---|---|---|
| Open | Backus Jeffery W | $314,407 | |
| Closed | Backus Jeffery W | $314,407 | |
| Previous Owner | Backus Jeffery W | $100,000 |
Source: Public Records
Tax History
| Year | Tax Paid | Tax Assessment Tax Assessment Total Assessment is a certain percentage of the fair market value that is determined by local assessors to be the total taxable value of land and additions on the property. | Land | Improvement |
|---|---|---|---|---|
| 2025 | $1,923 | $201,850 | $100,597 | $101,253 |
| 2024 | $1,867 | $197,450 | $117,300 | $80,150 |
| 2023 | $1,835 | $342,000 | $140,239 | $201,761 |
| 2022 | $1,793 | $181,500 | $73,912 | $107,588 |
| 2021 | $1,689 | $255,000 | $103,059 | $151,941 |
| 2020 | $1,526 | $221,000 | $86,977 | $134,023 |
| 2019 | $1,516 | $215,000 | $82,846 | $132,154 |
| 2018 | $1,362 | $194,000 | $82,846 | $111,154 |
| 2016 | $1,170 | $85,965 | $26,501 | $59,464 |
| 2015 | $1,088 | $75,845 | $26,501 | $49,344 |
| 2014 | $1,049 | $74,823 | $26,501 | $48,322 |
| 2013 | -- | $70,916 | $18,612 | $52,304 |
Source: Public Records
Map
Nearby Homes
Your Personal Tour Guide
Ask me questions while you tour the home.