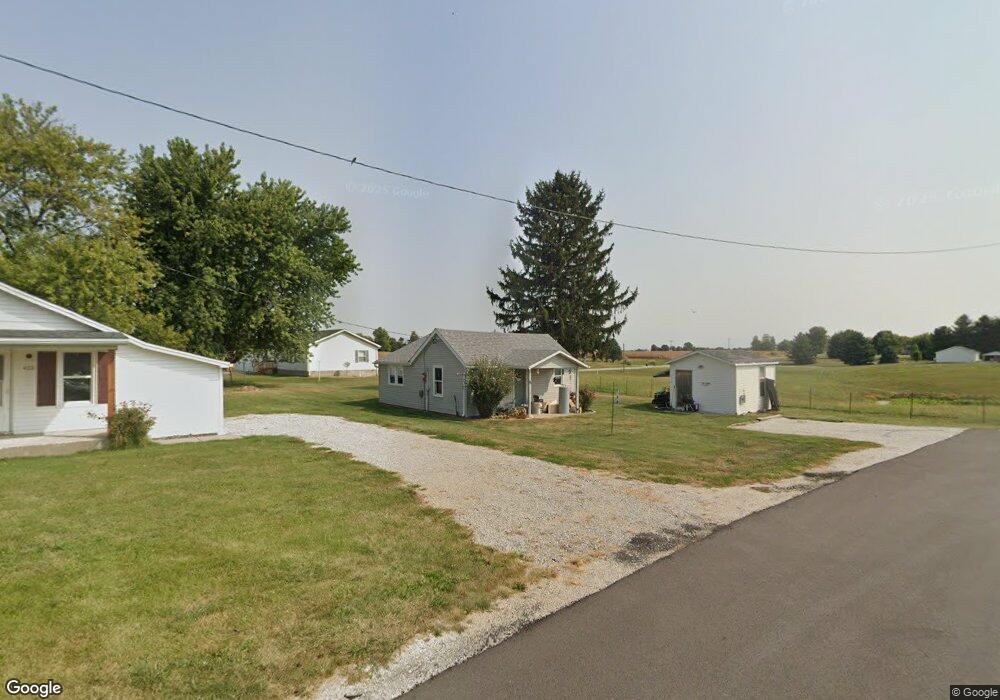
375 E Main St Fieldon, IL 62031
Estimated Value: $34,000 - $94,000
2
Beds
1
Bath
641
Sq Ft
$91/Sq Ft
Est. Value
About This Home
This home is located at 375 E Main St, Fieldon, IL 62031 and is currently estimated at $58,373, approximately $91 per square foot. 375 E Main St is a home located in Jersey County with nearby schools including Jersey Community High School.
Ownership History
Date
Name
Owned For
Owner Type
Purchase Details
Closed on
Dec 22, 2025
Sold by
Gettings Carissa
Bought by
Eveans Reese
Current Estimated Value
Purchase Details
Closed on
Dec 19, 2025
Sold by
Plunkett Patricia
Bought by
Gettings Carissa
Purchase Details
Closed on
Jun 24, 2019
Sold by
Plunkett Patricia
Bought by
Plunkett Patricia and Plunkett Carissa
Home Financials for this Owner
Home Financials are based on the most recent Mortgage that was taken out on this home.
Original Mortgage
$29,450
Interest Rate
4.1%
Mortgage Type
Purchase Money Mortgage
Purchase Details
Closed on
May 30, 2019
Sold by
Seehausen Gerald W and Seehausen Rosemary K
Bought by
Plunkett Patricia
Home Financials for this Owner
Home Financials are based on the most recent Mortgage that was taken out on this home.
Original Mortgage
$29,450
Interest Rate
4.1%
Mortgage Type
Purchase Money Mortgage
Purchase Details
Closed on
Mar 3, 2015
Sold by
Donald R Donald R
Bought by
Seehausen Gerald W and Seehausen Rosemary K
Create a Home Valuation Report for This Property
The Home Valuation Report is an in-depth analysis detailing your home's value as well as a comparison with similar homes in the area
Purchase History
| Date | Buyer | Sale Price | Title Company |
|---|---|---|---|
| Eveans Reese | $37,000 | Preferred Title | |
| Gettings Carissa | -- | None Listed On Document | |
| Plunkett Patricia | -- | -- | |
| Plunkett Patricia | $31,000 | -- | |
| Seehausen Gerald W | -- | -- |
Source: Public Records
Mortgage History
| Date | Status | Borrower | Loan Amount |
|---|---|---|---|
| Previous Owner | Plunkett Patricia | $29,450 |
Source: Public Records
Tax History
| Year | Tax Paid | Tax Assessment Tax Assessment Total Assessment is a certain percentage of the fair market value that is determined by local assessors to be the total taxable value of land and additions on the property. | Land | Improvement |
|---|---|---|---|---|
| 2024 | $402 | $12,275 | $2,440 | $9,835 |
| 2023 | $346 | $11,160 | $2,220 | $8,940 |
| 2022 | $311 | $10,430 | $2,075 | $8,355 |
| 2021 | $302 | $10,250 | $2,040 | $8,210 |
| 2020 | $695 | $9,670 | $1,925 | $7,745 |
| 2019 | $695 | $9,460 | $1,885 | $7,575 |
| 2018 | $686 | $9,460 | $1,885 | $7,575 |
| 2017 | $690 | $9,390 | $1,870 | $7,520 |
| 2016 | $692 | $9,390 | $1,870 | $7,520 |
| 2015 | -- | $9,390 | $1,870 | $7,520 |
| 2014 | -- | $9,405 | $1,875 | $7,530 |
Source: Public Records
Map
Nearby Homes
- 111 E Warren St
- 208 S Public Rd
- 000 Pump Station Rd
- 20326 Richey Hollow Rd
- TBD Hunting Club Rd
- 18723 S Creek Rd
- 00 Eldred Rd
- 236 Gallinipper Rd
- 117 S Hamilton St
- 706 S Park St
- 201 Barry St
- 212 Franklin St
- 208 N County Rd
- 305 Vineyard St
- 0 Waggoner Ave
- 1004 Brianna Ct
- 916 Brianna Ct
- 912 Hansen Gata
- 155 Roberts St
- 1115 W Exchange St
Your Personal Tour Guide
Ask me questions while you tour the home.