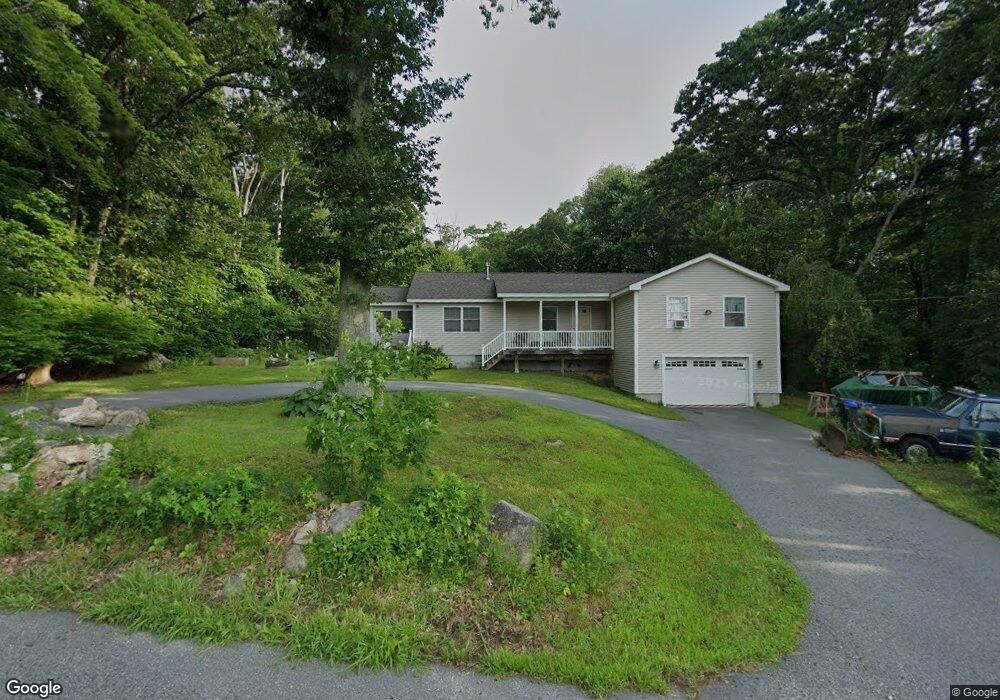
375 Hazel St Uxbridge, MA 01569
Estimated Value: $593,498 - $626,000
3
Beds
3
Baths
1,982
Sq Ft
$311/Sq Ft
Est. Value
About This Home
This home is located at 375 Hazel St, Uxbridge, MA 01569 and is currently estimated at $617,125, approximately $311 per square foot. 375 Hazel St is a home located in Worcester County with nearby schools including Uxbridge High School and Our Lady of the Valley Regional School.
Ownership History
Date
Name
Owned For
Owner Type
Purchase Details
Closed on
Feb 9, 2023
Sold by
Amaral Alicia D and Pincince Christopher A
Bought by
Amaral Ft and Amaral
Current Estimated Value
Purchase Details
Closed on
Feb 14, 2014
Sold by
Penland Victoria A
Bought by
Penland Victoria A and Pincince Alicia D
Home Financials for this Owner
Home Financials are based on the most recent Mortgage that was taken out on this home.
Original Mortgage
$150,000
Interest Rate
4.52%
Mortgage Type
New Conventional
Create a Home Valuation Report for This Property
The Home Valuation Report is an in-depth analysis detailing your home's value as well as a comparison with similar homes in the area
Home Values in the Area
Average Home Value in this Area
Purchase History
| Date | Buyer | Sale Price | Title Company |
|---|---|---|---|
| Amaral Ft | -- | None Available | |
| Penland Victoria A | -- | -- |
Source: Public Records
Mortgage History
| Date | Status | Borrower | Loan Amount |
|---|---|---|---|
| Previous Owner | Penland Victoria A | $150,000 |
Source: Public Records
Tax History
| Year | Tax Paid | Tax Assessment Tax Assessment Total Assessment is a certain percentage of the fair market value that is determined by local assessors to be the total taxable value of land and additions on the property. | Land | Improvement |
|---|---|---|---|---|
| 2025 | $7,440 | $567,500 | $149,800 | $417,700 |
| 2024 | $6,731 | $521,000 | $137,300 | $383,700 |
| 2023 | $6,195 | $444,100 | $124,800 | $319,300 |
| 2022 | $5,873 | $387,400 | $113,200 | $274,200 |
| 2021 | $6,050 | $382,400 | $108,200 | $274,200 |
| 2020 | $5,968 | $356,500 | $112,300 | $244,200 |
| 2019 | $5,965 | $343,800 | $104,000 | $239,800 |
| 2018 | $5,591 | $325,600 | $104,000 | $221,600 |
| 2017 | $5,081 | $299,600 | $94,700 | $204,900 |
| 2016 | $5,749 | $327,200 | $99,200 | $228,000 |
| 2015 | $3,450 | $198,300 | $99,200 | $99,100 |
Source: Public Records
Map
Nearby Homes
- 376 Douglas St
- 145 Mantell Rd
- 11 Summerfield Dr Unit 11
- 61 Spring Hill Dr Unit 61
- 395 High St
- 86 Hunter Rd
- 35 Beverly Ave
- 71 Rivulet St Unit B
- 26 Rivulet St
- 0 Homestead Ave
- 405 West St
- 138 Elm St
- 5 Peter St Unit D
- 235 Rivulet St
- 12 Hartford Ave E
- 95 High St Unit C
- 79 High St
- 16 Farnum St
- 583 Fletcher St
- 20 Maple St
Your Personal Tour Guide
Ask me questions while you tour the home.