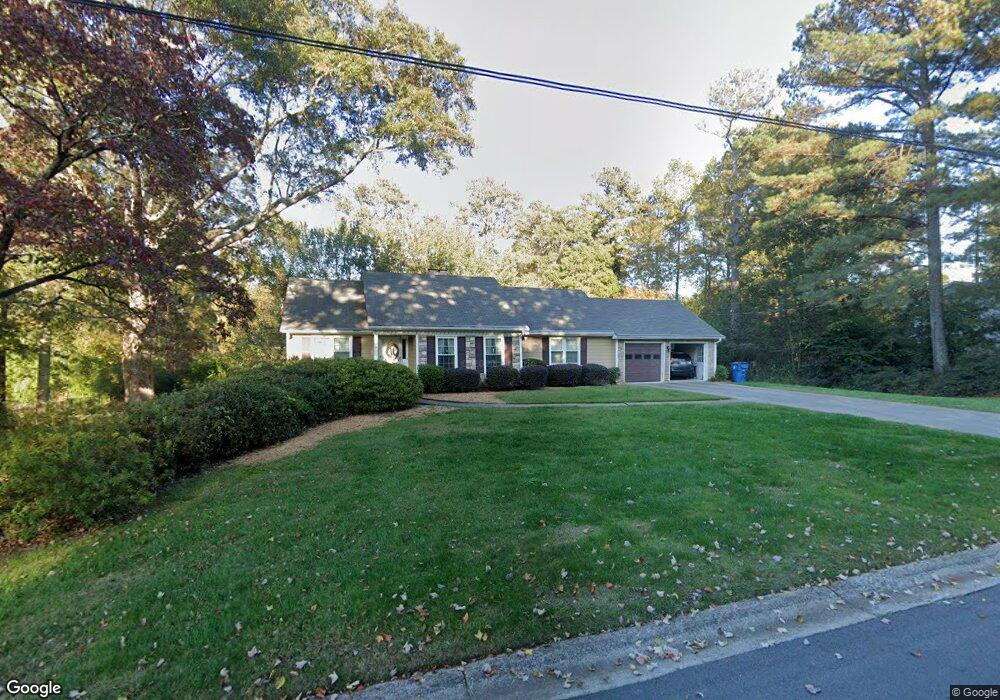
375 Heritage Ln Unit 2 Alpharetta, GA 30009
Estimated Value: $711,000 - $901,000
3
Beds
2
Baths
1,601
Sq Ft
$518/Sq Ft
Est. Value
About This Home
This home is located at 375 Heritage Ln Unit 2, Alpharetta, GA 30009 and is currently estimated at $828,597, approximately $517 per square foot. 375 Heritage Ln Unit 2 is a home located in Fulton County with nearby schools including Alpharetta Elementary School, Hopewell Middle School, and Cambridge High School.
Ownership History
Date
Name
Owned For
Owner Type
Purchase Details
Closed on
Feb 19, 2023
Sold by
Henderson Mark Jarrett
Bought by
Henderson Anna Elena
Current Estimated Value
Purchase Details
Closed on
Aug 13, 2013
Sold by
Lichtenwalner Anna Nodar
Bought by
Henderson Anna Elena
Purchase Details
Closed on
Sep 22, 2000
Sold by
Mccarty Royce G
Bought by
Lichtenwalner Matt M and Lichtenwalner Anna N
Home Financials for this Owner
Home Financials are based on the most recent Mortgage that was taken out on this home.
Original Mortgage
$135,900
Interest Rate
7.92%
Mortgage Type
New Conventional
Purchase Details
Closed on
Oct 27, 1995
Sold by
Johnson Dian Lawler
Bought by
Mccarty Royce G
Create a Home Valuation Report for This Property
The Home Valuation Report is an in-depth analysis detailing your home's value as well as a comparison with similar homes in the area
Home Values in the Area
Average Home Value in this Area
Purchase History
| Date | Buyer | Sale Price | Title Company |
|---|---|---|---|
| Henderson Anna Elena | $599,200 | -- | |
| Henderson Anna Elena | -- | -- | |
| Lichtenwalner Matt M | $169,900 | -- | |
| Mccarty Royce G | $131,500 | -- |
Source: Public Records
Mortgage History
| Date | Status | Borrower | Loan Amount |
|---|---|---|---|
| Previous Owner | Lichtenwalner Matt M | $135,900 | |
| Previous Owner | Lichtenwalner Matt M | $25,450 | |
| Closed | Mccarty Royce G | $0 |
Source: Public Records
Tax History
| Year | Tax Paid | Tax Assessment Tax Assessment Total Assessment is a certain percentage of the fair market value that is determined by local assessors to be the total taxable value of land and additions on the property. | Land | Improvement |
|---|---|---|---|---|
| 2025 | $397 | $330,160 | $151,400 | $178,760 |
| 2023 | $8,365 | $296,360 | $137,560 | $158,800 |
| 2022 | $1,729 | $296,360 | $137,560 | $158,800 |
| 2021 | $1,980 | $176,600 | $44,680 | $131,920 |
| 2020 | $2,025 | $213,640 | $141,400 | $72,240 |
| 2019 | $271 | $128,320 | $37,520 | $90,800 |
| 2018 | $2,618 | $125,320 | $36,640 | $88,680 |
| 2017 | $2,003 | $68,640 | $21,000 | $47,640 |
| 2016 | $2,003 | $68,640 | $21,000 | $47,640 |
| 2015 | $2,406 | $68,640 | $21,000 | $47,640 |
| 2014 | $2,104 | $68,640 | $21,000 | $47,640 |
Source: Public Records
Map
Nearby Homes
- 355 Heritage Ln Unit 1
- 170 Mayfield Cir
- 135 Mayfield Cir
- 1805 Broadwell Oaks Dr
- 202 Kenneth Dr
- 12215 Belvoir Ln
- 205 Mayfield Cir
- 238 Brooke Dr
- 250 Mayfield Rd
- 260 Mayfield Rd
- 379 Milton Ave
- 1410 Richards Cir Unit 2
- 265 Mayfield Rd
- 130 Trammell Ct
- 1880 Mayfield Rd
- 179 Meadow Dr
- 8035 Canter Ln
- 193 Jere Dr
- 3018 Steeplechase
- 210 Shady Grove Ln
- 365 Heritage Ln
- 385 Heritage Ln
- 378 Meadow Dr
- 382 Heritage Ln Unit 2
- 382 Heritage Ln
- 368 Meadow Dr
- 392 Heritage Ln
- 372 Heritage Ln Unit 2
- 395 Heritage Ln
- 388 Meadow Dr
- 362 Mayfield Cir
- 362 Heritage Ln
- 140 Mayfield Cir
- 1730 Broadwell Oaks Dr
- 1720 Broadwell Oaks Dr
- 1740 Broadwell Oaks Dr
- 381 Meadow Dr
- 381 Meadow Dr Unit Un 2
- 150 Mayfield Cir
- 345 Heritage Ln
Your Personal Tour Guide
Ask me questions while you tour the home.