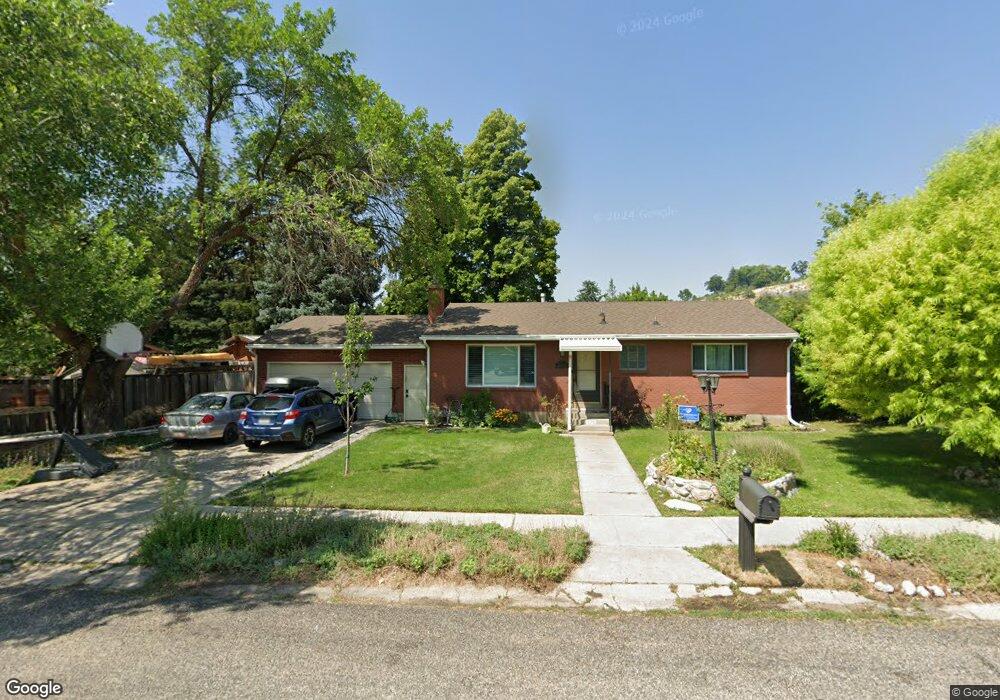
375 Lauralin Dr Logan, UT 84321
Wilson NeighborhoodEstimated Value: $416,000 - $428,000
5
Beds
2
Baths
2,240
Sq Ft
$190/Sq Ft
Est. Value
About This Home
This home is located at 375 Lauralin Dr, Logan, UT 84321 and is currently estimated at $424,626, approximately $189 per square foot. 375 Lauralin Dr is a home located in Cache County with nearby schools including Wilson School, Mount Logan Middle School, and Logan High School.
Ownership History
Date
Name
Owned For
Owner Type
Purchase Details
Closed on
Mar 16, 2020
Sold by
Dudley Dave
Bought by
York Sharla Adrianne
Current Estimated Value
Home Financials for this Owner
Home Financials are based on the most recent Mortgage that was taken out on this home.
Original Mortgage
$229,630
Outstanding Balance
$202,932
Interest Rate
3.5%
Mortgage Type
New Conventional
Estimated Equity
$221,694
Purchase Details
Closed on
Apr 5, 2011
Sold by
National Residential Nominee Services In
Bought by
Dudley Dave
Home Financials for this Owner
Home Financials are based on the most recent Mortgage that was taken out on this home.
Original Mortgage
$152,922
Interest Rate
4.25%
Mortgage Type
FHA
Purchase Details
Closed on
Mar 14, 2011
Sold by
Wilson Kendal L and Wilson Peggy L
Bought by
National Residential Nominee Services In
Home Financials for this Owner
Home Financials are based on the most recent Mortgage that was taken out on this home.
Original Mortgage
$152,922
Interest Rate
4.25%
Mortgage Type
FHA
Create a Home Valuation Report for This Property
The Home Valuation Report is an in-depth analysis detailing your home's value as well as a comparison with similar homes in the area
Home Values in the Area
Average Home Value in this Area
Purchase History
| Date | Buyer | Sale Price | Title Company |
|---|---|---|---|
| York Sharla Adrianne | -- | American Secure Ttl Tremonto | |
| Dudley Dave | -- | Northern Title Company | |
| National Residential Nominee Services In | -- | Northern Title Company |
Source: Public Records
Mortgage History
| Date | Status | Borrower | Loan Amount |
|---|---|---|---|
| Open | York Sharla Adrianne | $229,630 | |
| Previous Owner | Dudley Dave | $152,922 |
Source: Public Records
Tax History
| Year | Tax Paid | Tax Assessment Tax Assessment Total Assessment is a certain percentage of the fair market value that is determined by local assessors to be the total taxable value of land and additions on the property. | Land | Improvement |
|---|---|---|---|---|
| 2025 | $1,712 | $221,470 | $0 | $0 |
| 2024 | $18 | $221,470 | $0 | $0 |
| 2023 | $1,844 | $220,150 | $0 | $0 |
| 2022 | $1,733 | $193,255 | $0 | $0 |
| 2021 | $1,618 | $278,710 | $71,100 | $207,610 |
| 2020 | $1,489 | $230,800 | $71,100 | $159,700 |
| 2019 | $1,556 | $230,800 | $71,100 | $159,700 |
| 2018 | $1,353 | $183,212 | $71,100 | $112,112 |
| 2017 | $1,138 | $81,455 | $0 | $0 |
| 2016 | $1,179 | $81,455 | $0 | $0 |
| 2015 | $1,181 | $81,455 | $0 | $0 |
| 2014 | $1,067 | $81,455 | $0 | $0 |
| 2013 | -- | $76,430 | $0 | $0 |
Source: Public Records
Map
Nearby Homes
- 1045 Fox Farm Rd
- 2758 N Canyon Cove Dr
- 2738 N Canyon Cove Dr
- 1034 Thrushwood Dr
- 684 Apple Dr
- 1374 E 260 N
- 1387 E 260 N
- 622 Canyon Rd
- 28 River Pointe Dr
- 70 River Pointe Dr
- 74 Canterbury Cir
- 640 E 600 N
- 545 E Boulevard St
- 620 E 600 N
- 631 E 600 N
- 1164 E Mountain Rd
- 1147 Eastridge Dr
- 1535 Sumac Dr
- 642 E 700 N
- 128 S 1170 E
- 310 Lauralin Dr
- 367 Lauralin Dr
- 316 Lauralin Dr
- 355 Lauralin Dr
- 372 Lauralin Dr
- 320 Lauralin Dr
- 380 Lauralin Dr
- 330 Lauralin Dr
- 309 Lauralin Dr
- 368 Lauralin Dr
- 384 Lauralin Dr
- 305 Lauralin Dr
- 313 Lauralin Dr
- 362 Lauralin Dr
- 317 Lauralin Dr
- 358 Lauralin Dr
- 354 Lauralin Dr
- 393 Lauralin Dr
- 388 Lauralin Dr
- 350 Lauralin Dr
Your Personal Tour Guide
Ask me questions while you tour the home.