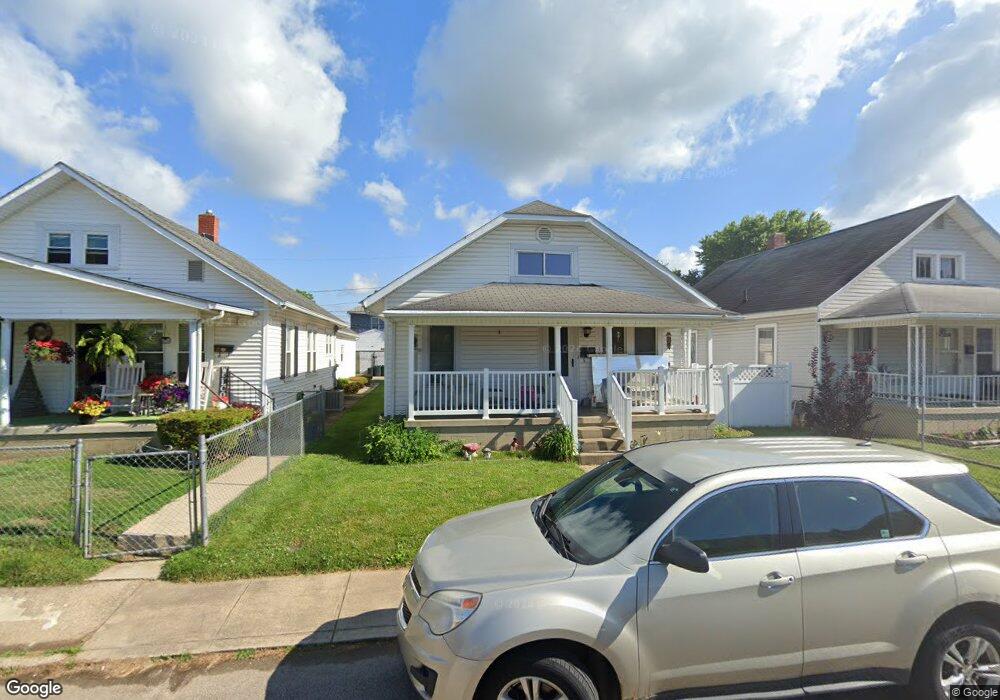
375 Neal Ave Chillicothe, OH 45601
Estimated Value: $110,000 - $120,160
2
Beds
1
Bath
862
Sq Ft
$133/Sq Ft
Est. Value
About This Home
This home is located at 375 Neal Ave, Chillicothe, OH 45601 and is currently estimated at $115,040, approximately $133 per square foot. 375 Neal Ave is a home located in Ross County with nearby schools including Chillicothe High School, Bishop Flaget School, and Wesley Taylor Preparatory School.
Ownership History
Date
Name
Owned For
Owner Type
Purchase Details
Closed on
Jun 13, 2016
Sold by
Wolfe Richard K and Wolfe Tina R
Bought by
Painter Melinda and Painter Mark E
Current Estimated Value
Home Financials for this Owner
Home Financials are based on the most recent Mortgage that was taken out on this home.
Original Mortgage
$46,000
Outstanding Balance
$36,659
Interest Rate
3.61%
Mortgage Type
New Conventional
Estimated Equity
$78,381
Purchase Details
Closed on
Aug 15, 2013
Sold by
Merrow James Thomas and Merrow Caroline L
Bought by
Wolfe Riochard K and Wolfe Tina R
Create a Home Valuation Report for This Property
The Home Valuation Report is an in-depth analysis detailing your home's value as well as a comparison with similar homes in the area
Home Values in the Area
Average Home Value in this Area
Purchase History
| Date | Buyer | Sale Price | Title Company |
|---|---|---|---|
| Painter Melinda | $57,500 | Arrow Title | |
| Wolfe Riochard K | $45,500 | Arrow Title Agency Llc |
Source: Public Records
Mortgage History
| Date | Status | Borrower | Loan Amount |
|---|---|---|---|
| Open | Painter Melinda | $46,000 |
Source: Public Records
Tax History Compared to Growth
Tax History
| Year | Tax Paid | Tax Assessment Tax Assessment Total Assessment is a certain percentage of the fair market value that is determined by local assessors to be the total taxable value of land and additions on the property. | Land | Improvement |
|---|---|---|---|---|
| 2024 | $986 | $24,740 | $3,030 | $21,710 |
| 2023 | $986 | $24,740 | $3,030 | $21,710 |
| 2022 | $1,004 | $24,740 | $3,030 | $21,710 |
| 2021 | $894 | $19,310 | $2,700 | $16,610 |
| 2020 | $894 | $19,310 | $2,700 | $16,610 |
| 2019 | $894 | $19,310 | $2,700 | $16,610 |
| 2018 | $909 | $18,600 | $2,700 | $15,900 |
| 2017 | $979 | $18,600 | $2,700 | $15,900 |
| 2016 | $969 | $18,600 | $2,700 | $15,900 |
| 2015 | $909 | $17,040 | $2,700 | $14,340 |
| 2014 | $889 | $17,040 | $2,700 | $14,340 |
| 2013 | $916 | $17,040 | $2,700 | $14,340 |
Source: Public Records
Map
Nearby Homes