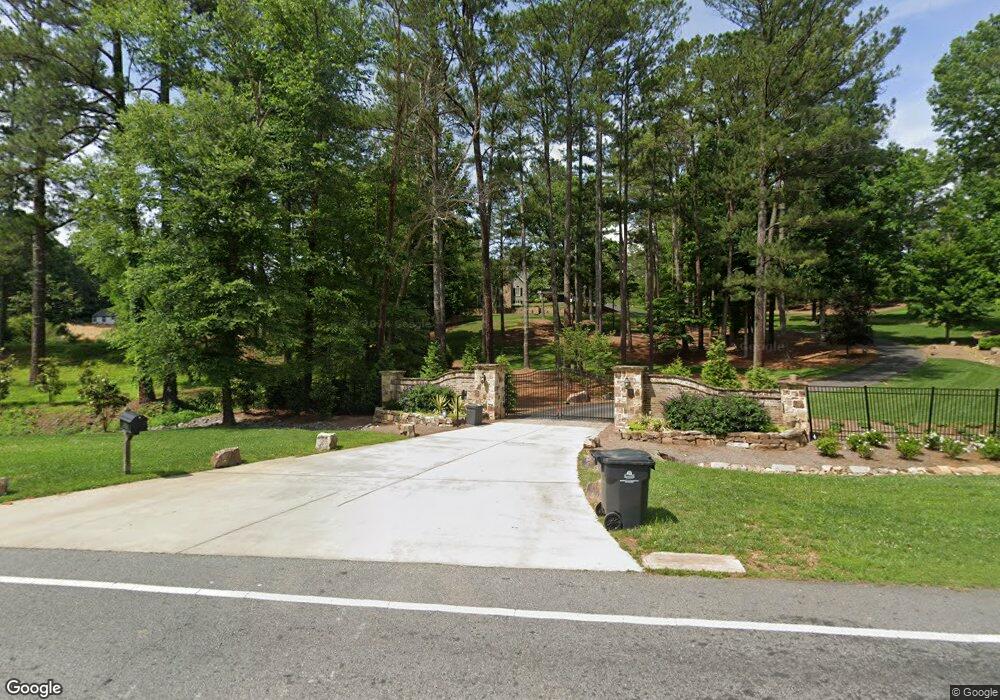
375 Pine Grove Rd Unit 3 Roswell, GA 30075
Estimated Value: $1,330,000 - $2,684,369
5
Beds
6
Baths
4,335
Sq Ft
$462/Sq Ft
Est. Value
About This Home
This home is located at 375 Pine Grove Rd Unit 3, Roswell, GA 30075 and is currently estimated at $2,001,342, approximately $461 per square foot. 375 Pine Grove Rd Unit 3 is a home located in Fulton County with nearby schools including Roswell North Elementary School, Crabapple Middle School, and Roswell High School.
Ownership History
Date
Name
Owned For
Owner Type
Purchase Details
Closed on
Jan 26, 2022
Sold by
Vann Katharyn
Bought by
Piana Andrea
Current Estimated Value
Purchase Details
Closed on
Aug 4, 2017
Sold by
Morris Kimberly Gesnes
Bought by
Vann Brannon and Vann Katharyn
Home Financials for this Owner
Home Financials are based on the most recent Mortgage that was taken out on this home.
Original Mortgage
$918,750
Interest Rate
3.75%
Mortgage Type
New Conventional
Purchase Details
Closed on
Aug 9, 2001
Sold by
Nall & Miller Llp
Bought by
Tackitt Bobby O and Tackitt Kimberly M
Home Financials for this Owner
Home Financials are based on the most recent Mortgage that was taken out on this home.
Original Mortgage
$60,400
Interest Rate
7.3%
Mortgage Type
New Conventional
Create a Home Valuation Report for This Property
The Home Valuation Report is an in-depth analysis detailing your home's value as well as a comparison with similar homes in the area
Home Values in the Area
Average Home Value in this Area
Purchase History
| Date | Buyer | Sale Price | Title Company |
|---|---|---|---|
| Piana Andrea | $2,400,000 | -- | |
| Vann Brannon | $1,225,000 | -- | |
| Tackitt Bobby O | -- | -- |
Source: Public Records
Mortgage History
| Date | Status | Borrower | Loan Amount |
|---|---|---|---|
| Previous Owner | Vann Brannon | $918,750 | |
| Previous Owner | Vann Brannon | $122,500 | |
| Previous Owner | Tackitt Bobby O | $60,400 |
Source: Public Records
Tax History Compared to Growth
Tax History
| Year | Tax Paid | Tax Assessment Tax Assessment Total Assessment is a certain percentage of the fair market value that is determined by local assessors to be the total taxable value of land and additions on the property. | Land | Improvement |
|---|---|---|---|---|
| 2025 | $3,523 | $694,680 | $116,560 | $578,120 |
| 2023 | $20,094 | $711,880 | $116,560 | $595,320 |
| 2022 | $7,113 | $411,520 | $116,560 | $294,960 |
| 2021 | $8,412 | $399,520 | $113,160 | $286,360 |
| 2020 | $8,557 | $394,800 | $111,840 | $282,960 |
| 2019 | $1,414 | $373,080 | $153,640 | $219,440 |
| 2018 | $8,104 | $490,000 | $336,360 | $153,640 |
| 2017 | $8,381 | $299,200 | $240,760 | $58,440 |
| 2016 | $8,381 | $299,200 | $240,760 | $58,440 |
| 2015 | $10,047 | $299,200 | $240,760 | $58,440 |
| 2014 | $8,781 | $299,200 | $240,760 | $58,440 |
Source: Public Records
Map
Nearby Homes
- 375 Pine Grove Rd
- 1100 Crest Brook Ln
- 1090 Crest Brook Ln
- 1105 Lake Dr
- 1095 Lake Dr
- 1115 Lake Dr
- 1120 Crest Brook Ln Unit 2
- 1080 Lake Dr
- 1125 Lake Dr
- 1130 Crest Brook Ln Unit 2
- 385 Pine Grove Rd
- 351 Pine Grove Rd
- 1125 Crest Brook Ln
- 1135 Lake Dr
- 1090 Lake Dr
- 1100 Lake Dr
- 0 Crest Brook Ln Unit 7487241
- 0 Crest Brook Ln
- 10160 N Coleman Rd
- 10180 N Coleman Rd