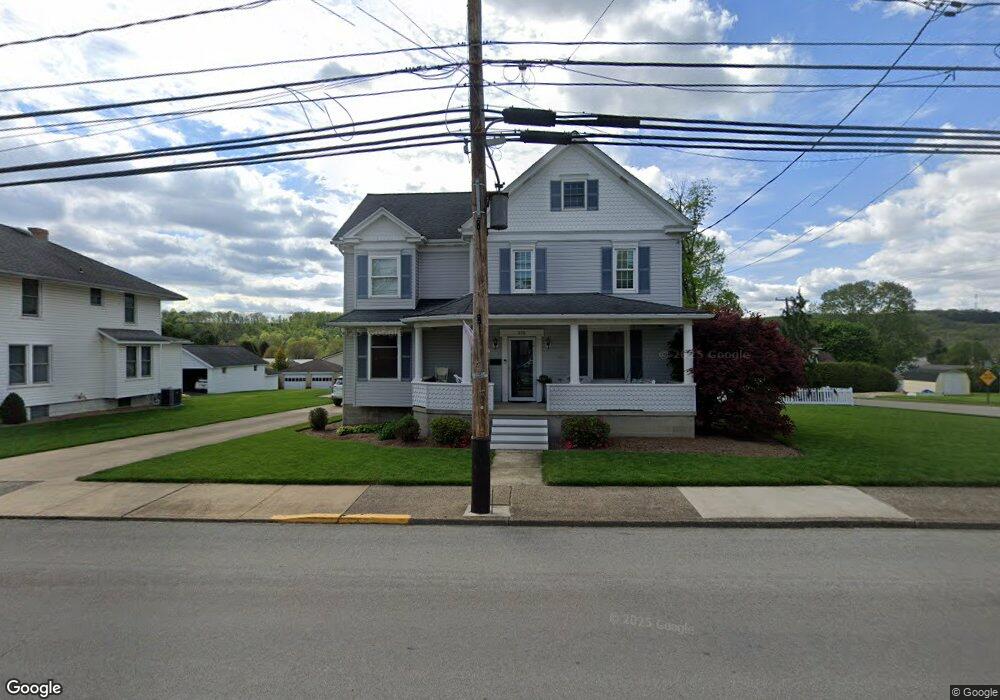
375 S Main St Homer City, PA 15748
Estimated Value: $111,000 - $137,000
3
Beds
1
Bath
1,024
Sq Ft
$123/Sq Ft
Est. Value
About This Home
This home is located at 375 S Main St, Homer City, PA 15748 and is currently estimated at $126,056, approximately $123 per square foot. 375 S Main St is a home located in Indiana County with nearby schools including Homer-Center Elementary School and Homer-Center Junior/Senior High School.
Ownership History
Date
Name
Owned For
Owner Type
Purchase Details
Closed on
Oct 29, 2009
Sold by
Sasala Christopher A and Sasala Joy A
Bought by
Graham Christopher S
Current Estimated Value
Home Financials for this Owner
Home Financials are based on the most recent Mortgage that was taken out on this home.
Original Mortgage
$107,809
Interest Rate
4.57%
Mortgage Type
VA
Purchase Details
Closed on
Nov 28, 2006
Sold by
Haranus Barbara
Bought by
Haranus Barbara
Create a Home Valuation Report for This Property
The Home Valuation Report is an in-depth analysis detailing your home's value as well as a comparison with similar homes in the area
Home Values in the Area
Average Home Value in this Area
Purchase History
| Date | Buyer | Sale Price | Title Company |
|---|---|---|---|
| Graham Christopher S | $105,540 | None Available | |
| Haranus Barbara | -- | None Available |
Source: Public Records
Mortgage History
| Date | Status | Borrower | Loan Amount |
|---|---|---|---|
| Previous Owner | Graham Christopher S | $107,809 |
Source: Public Records
Tax History Compared to Growth
Tax History
| Year | Tax Paid | Tax Assessment Tax Assessment Total Assessment is a certain percentage of the fair market value that is determined by local assessors to be the total taxable value of land and additions on the property. | Land | Improvement |
|---|---|---|---|---|
| 2025 | $2,138 | $76,000 | $18,500 | $57,500 |
| 2024 | $2,107 | $76,000 | $18,500 | $57,500 |
| 2023 | $1,996 | $76,000 | $18,500 | $57,500 |
| 2022 | $1,906 | $76,000 | $18,500 | $57,500 |
| 2021 | $1,906 | $76,000 | $18,500 | $57,500 |
| 2020 | $1,872 | $76,000 | $18,500 | $57,500 |
| 2018 | $1,861 | $76,000 | $18,500 | $57,500 |
| 2017 | $1,870 | $76,000 | $18,500 | $57,500 |
| 2016 | -- | $76,000 | $18,500 | $57,500 |
| 2015 | -- | $6,370 | $1,900 | $4,470 |
| 2014 | -- | $6,370 | $1,900 | $4,470 |
Source: Public Records
Map
Nearby Homes