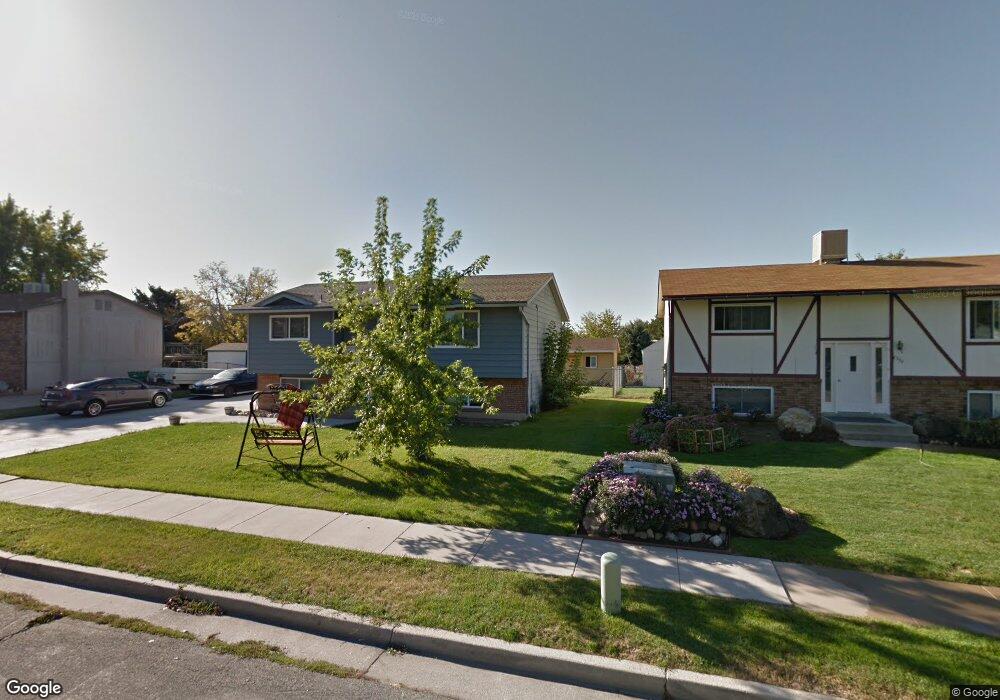
375 W 2300 N Clearfield, UT 84015
Estimated Value: $397,000 - $427,000
3
Beds
2
Baths
1,853
Sq Ft
$220/Sq Ft
Est. Value
About This Home
This home is located at 375 W 2300 N, Clearfield, UT 84015 and is currently estimated at $407,721, approximately $220 per square foot. 375 W 2300 N is a home located in Davis County with nearby schools including Sunset School, Sunset Junior High School, and Northridge High School.
Ownership History
Date
Name
Owned For
Owner Type
Purchase Details
Closed on
Nov 18, 2024
Sold by
Dammaschke Enzio and Dammaschke Andreana
Bought by
Howland Travis M
Current Estimated Value
Home Financials for this Owner
Home Financials are based on the most recent Mortgage that was taken out on this home.
Original Mortgage
$423,922
Outstanding Balance
$419,268
Interest Rate
6.12%
Mortgage Type
VA
Estimated Equity
-$11,547
Purchase Details
Closed on
Apr 22, 2021
Sold by
Thomas Lori A and The Shlrlee A Thomas Living Tr
Bought by
Dammaschke Enzio and Dammaschko Andreana
Home Financials for this Owner
Home Financials are based on the most recent Mortgage that was taken out on this home.
Original Mortgage
$21,503
Interest Rate
2.97%
Mortgage Type
New Conventional
Purchase Details
Closed on
Oct 15, 2010
Sold by
Thomas Shirlee
Bought by
The Shirlee A Thomas Living Trust and Thomas Shirlee A
Create a Home Valuation Report for This Property
The Home Valuation Report is an in-depth analysis detailing your home's value as well as a comparison with similar homes in the area
Home Values in the Area
Average Home Value in this Area
Purchase History
| Date | Buyer | Sale Price | Title Company |
|---|---|---|---|
| Howland Travis M | -- | Sutherland Title | |
| Howland Travis M | -- | Sutherland Title | |
| Dammaschke Enzio | -- | Lincoln Title Insurance | |
| The Shirlee A Thomas Living Trust | -- | First American Title |
Source: Public Records
Mortgage History
| Date | Status | Borrower | Loan Amount |
|---|---|---|---|
| Open | Howland Travis M | $423,922 | |
| Closed | Howland Travis M | $423,922 | |
| Previous Owner | Dammaschke Enzio | $21,503 | |
| Previous Owner | Dammaschke Enzio | $358,388 |
Source: Public Records
Tax History Compared to Growth
Tax History
| Year | Tax Paid | Tax Assessment Tax Assessment Total Assessment is a certain percentage of the fair market value that is determined by local assessors to be the total taxable value of land and additions on the property. | Land | Improvement |
|---|---|---|---|---|
| 2025 | $2,279 | $207,900 | $57,802 | $150,098 |
| 2024 | $2,231 | $203,500 | $55,261 | $148,239 |
| 2023 | $2,068 | $344,000 | $110,550 | $233,450 |
| 2022 | $2,230 | $200,750 | $63,421 | $137,329 |
| 2021 | $1,774 | $251,000 | $67,259 | $183,741 |
| 2020 | $100 | $216,000 | $56,552 | $159,448 |
| 2019 | $83 | $209,000 | $73,602 | $135,398 |
| 2018 | $45 | $182,000 | $58,819 | $123,181 |
| 2016 | $32 | $86,845 | $27,804 | $59,041 |
| 2015 | $1,156 | $78,595 | $27,804 | $50,791 |
| 2014 | $1,012 | $70,346 | $27,763 | $42,583 |
| 2013 | $993 | $65,670 | $23,265 | $42,405 |
Source: Public Records
Map
Nearby Homes
- 2512 N 475 W
- 389 W 2575 N
- 244 W 2575 N
- 2593 N 500 W Unit 56
- 2602 N 2125 W
- 2486 N 690 W
- 2588 N 2125 W
- 2612 N 525 W
- 428 W 2650 N
- 480 W 2650 N
- 484 W 2650 N
- 2382 N 770 W
- 2606 N 2125 W
- 2085 N Main St Unit 409
- 2085 N Main St Unit 108
- 2085 N Main St Unit 401
- 2085 N Main St Unit 308
- 2085 N Main St Unit 116
- 2085 N Main St Unit 201
- 2085 N Main St Unit 402