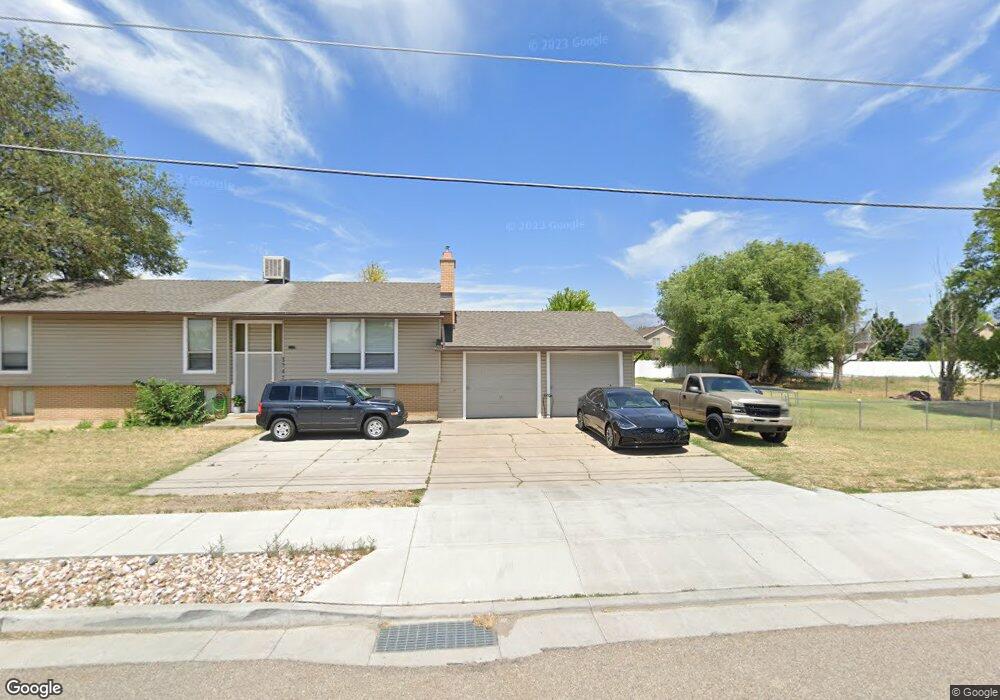
3750 W 4000 S West Haven, UT 84401
Estimated Value: $572,812 - $628,000
7
Beds
3
Baths
2,591
Sq Ft
$229/Sq Ft
Est. Value
About This Home
This home is located at 3750 W 4000 S, West Haven, UT 84401 and is currently estimated at $594,453, approximately $229 per square foot. 3750 W 4000 S is a home located in Weber County with nearby schools including Kanesville Elementary School, Rocky Mountain Junior High School, and Fremont High School.
Ownership History
Date
Name
Owned For
Owner Type
Purchase Details
Closed on
Jul 1, 2011
Sold by
Kt & T Inc
Bought by
Kt & T Ventures Llc
Current Estimated Value
Home Financials for this Owner
Home Financials are based on the most recent Mortgage that was taken out on this home.
Original Mortgage
$365,000
Outstanding Balance
$249,648
Interest Rate
4.54%
Mortgage Type
Purchase Money Mortgage
Estimated Equity
$344,805
Purchase Details
Closed on
Sep 9, 2000
Sold by
Futures Through Choices Inc
Bought by
K T & T Inc
Purchase Details
Closed on
Jul 19, 1999
Sold by
Bauman Larry R and Bauman Rose M
Bought by
Future Through Choices Unc
Home Financials for this Owner
Home Financials are based on the most recent Mortgage that was taken out on this home.
Original Mortgage
$97,930
Interest Rate
7.51%
Mortgage Type
Purchase Money Mortgage
Create a Home Valuation Report for This Property
The Home Valuation Report is an in-depth analysis detailing your home's value as well as a comparison with similar homes in the area
Home Values in the Area
Average Home Value in this Area
Purchase History
| Date | Buyer | Sale Price | Title Company |
|---|---|---|---|
| Kt & T Ventures Llc | -- | Inwest Title Services Layton | |
| K T & T Inc | -- | Associated Title | |
| Future Through Choices Unc | -- | Associated Title |
Source: Public Records
Mortgage History
| Date | Status | Borrower | Loan Amount |
|---|---|---|---|
| Open | Kt & T Ventures Llc | $365,000 | |
| Previous Owner | Future Through Choices Unc | $97,930 |
Source: Public Records
Tax History Compared to Growth
Tax History
| Year | Tax Paid | Tax Assessment Tax Assessment Total Assessment is a certain percentage of the fair market value that is determined by local assessors to be the total taxable value of land and additions on the property. | Land | Improvement |
|---|---|---|---|---|
| 2025 | $2,997 | $537,344 | $143,286 | $394,058 |
| 2024 | $2,891 | $528,000 | $143,553 | $384,447 |
| 2023 | $2,712 | $491,000 | $122,035 | $368,965 |
| 2022 | $2,441 | $248,638 | $57,470 | $191,168 |
| 2021 | $2,215 | $382,000 | $56,572 | $325,428 |
| 2020 | $2,193 | $347,000 | $46,263 | $300,737 |
| 2019 | $2,092 | $313,000 | $53,806 | $259,194 |
| 2018 | $1,885 | $270,000 | $45,569 | $224,431 |
| 2017 | $1,754 | $244,000 | $45,498 | $198,502 |
| 2016 | $1,532 | $115,281 | $26,285 | $88,996 |
| 2015 | $1,553 | $115,283 | $26,285 | $88,998 |
| 2014 | $1,364 | $98,796 | $20,728 | $78,068 |
Source: Public Records
Map
Nearby Homes
- 3791 S 3750 W
- 3555 W 3900 S
- 3724 S 3650 W
- 4124 S 3560 W
- 3984 W 4000 S
- 3959 S 3485 W
- 3942 S 3450 W
- 4080 W 4000 S
- 4351 W 4000 S
- 3385 W 3950 S
- 4612 W 3725 S Unit 236
- 3960 S 3375 W
- 3367 W 3785 S
- 3329 W 3745 S
- 3327 W 3745 S Unit 4050
- 3321 W 3745 S
- 3327 W 3715 S
- 3610 W 4475 S
- 4317 S 3350 W
- Villages Townhome Plan at Green Farm - Villages